All,
I am trying to add trend-arrow PNGs to a plot. Please find a not so minimal example below… I have included images from three different sources and none of them work.
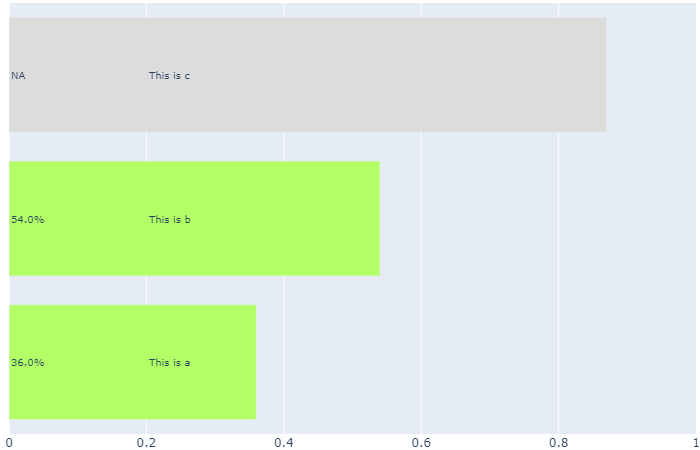
Can you help me? The plot looks like this at the moment, I want to include at the rightmost end of each bar the png (but smaller than its original size).
Relevant code snippet where I include images:
def add_arrows(totf_df, fig):
    img_width = 265
    img_height = 265
    scaling = 0.12
    i = 0
    for index, row in totf_df.iterrows():
        trend = round(row['Change1'] * 100, 2)
        for index, row in totf_df.iterrows():
            trend = round(row["P1"] * 100, 2)
            if trend > 0:
                fig.add_layout_image(
                    dict(
                        source="https://i.imgur.com/XKnE9Fr.png",
                        x=1-img_width,
                        y=i
                    )
                )
            elif trend < 0:
                fig.add_layout_image(
                    dict(
                        source="https://images.plot.ly/language-icons/api-home/python-logo.png",
                        x=1 - img_width,
                        y=i
                    )
                )
            else:
                fig.add_layout_image(
                    dict(
                        x=1 - img_width*scaling,
                        y=i - img_height*scaling,
                        source="https://github.com/mafis103/DataA/blob/master/notrend.png")
                )
        i=i+1

    fig.update_layout_images(dict(
        xref="x",
        yref="y",
        sizex=img_height * scaling,
        sizey=img_height * scaling,
        xanchor="right",
        yanchor="bottom"
    ))
    return fig
Full code:
import json
from pprint import pprint
import dash_table
import base64
import math
import dash
import dash_core_components as dcc
import dash_html_components as html
from dash.dependencies import Input, Output
from plotly import graph_objs as go
import plotly.express as px
import pandas as pd

external_stylesheets = ['https://codepen.io/chriddyp/pen/bWLwgP.css']

app = dash.Dash(__name__, external_stylesheets=external_stylesheets)

Content=["a", "b", "c"]
Artifact = ["a", "b", "c"]
Version = ["1.0", "1.1", "1.2"]
P1 = [0.36, 0.54, 0.87]
Change1 = [0.10, -0.3, None]
totf_df = pd.DataFrame(list(zip(Content, Artifact, Version, P1, Change1)))
totf_df.columns=["Content ID", "Artifact", "Version", "P1", "Change1"]
totf_df['Percent'] = round(totf_df['P1'] * 100, 2)


def find_names(totf_df):
    names = list()
    for index, row in totf_df[['Content ID', 'Artifact']].iterrows():
        if row[0] == "a" and row[1] == "a":
            names.append("This is a")
        elif row[0] == "b" and row[1] == "b":
            names.append("This is b")
        elif row[0] == "c" and row[1] == "c":
            names.append("This is c")
        else:
            names.append("NA")
    return names


def set_yaxis(totf_df):
    empty = list()
    for index, row in totf_df[['Content ID']].iterrows():
        if index == 0:
            empty.append('')
        else:
            x = " " * index
            empty.append(x)
    return empty


totf_df['Name'] = find_names(totf_df)
totf_df['Empty'] = set_yaxis(totf_df)
totf_df = totf_df.sort_values(['P1'], ascending=[1])


def define_colors(totf_df):
    colors = list()
    for index, row in totf_df[['P1', 'Change1']].iterrows():
        if (row[0] < 0.25) & (math.isnan(row[1]) == False):
            colors.append("rgba(255,204,203,1)")
        elif (row[0] >= 0.25) & (row[0] < 0.92) & (math.isnan(row[1]) == False):
            colors.append("rgba(178,255,102,1)")
        elif (row[0] > 0.92) & (math.isnan(row[1]) == False):
            colors.append("rgba(255,165,0,1)")
        else:
            colors.append("rgba(220,220,220,1)")
    return colors


def add_text(totf_df, fig):
    i = 0
    for index, row in totf_df.iterrows():
        trend = round(row['Change1']*100, 2)
        if trend > 0:
            trend = "+" + str(trend) + "%"
        else:
            trend = str(trend) + "%"
        if math.isnan(row['Change1']):
            percent = "NA"
            trend = "NA"
        else:
            percent = str(row['Percent']) + "%"
        fig.add_annotation(
            x=0,
            y=i,
            xanchor="left",
            xref="x",
            yref="y",
            text=percent,
            showarrow=False
        )
        fig.add_annotation(
            x=0.2,
            xanchor="left",
            y=i,
            xref="x",
            yref="y",
            text=row['Name'],
            showarrow=False
        )
        i = i + 1
    return fig

def add_arrows(totf_df, fig):
    img_width = 265
    img_height = 265
    scaling = 0.12
    i = 0
    for index, row in totf_df.iterrows():
        trend = round(row['Change1'] * 100, 2)
        for index, row in totf_df.iterrows():
            trend = round(row["P1"] * 100, 2)
            if trend > 0:
                fig.add_layout_image(
                    dict(
                        source="https://i.imgur.com/XKnE9Fr.png",
                        x=1-img_width,
                        y=i
                    )
                )
            elif trend < 0:
                fig.add_layout_image(
                    dict(
                        source="https://images.plot.ly/language-icons/api-home/python-logo.png",
                        x=1 - img_width,
                        y=i
                    )
                )
            else:
                fig.add_layout_image(
                    dict(
                        x=1 - img_width*scaling,
                        y=i - img_height*scaling,
                        source="https://github.com/mafis103/DataA/blob/master/notrend.png")
                )
        i=i+1

    fig.update_layout_images(dict(
        xref="x",
        yref="y",
        sizex=img_height * scaling,
        sizey=img_height * scaling,
        xanchor="right",
        yanchor="bottom"
    ))
    return fig


def totf(totf_df):
    colors = define_colors(totf_df)
    fig = go.Figure(go.Bar(x=totf_df['P1'], y=totf_df['Empty'], orientation='h', textposition='inside', showlegend=False,
                           marker_color=colors))
    fig.update_layout(margin=dict(l=0, r=3, t=3, b=3), xaxis=dict(range=[0,1]), autosize=False)
    fig = add_text(totf_df, fig)
    fig = add_arrows(totf_df, fig)
    fig.update_annotations(font=dict(size=10))
    return fig


app.layout = html.Div([
    html.Div([dcc.Graph(
        id='totf',
    )], style={'display': 'inline-block', 'width': '24%'})
])


@app.callback(
    Output('totf', 'figure'),
    [Input('totf', 'relayoutData')])
def display_graph(relayoutData):
    return totf(totf_df)


if __name__ == '__main__':
    app.run_server(debug=True)