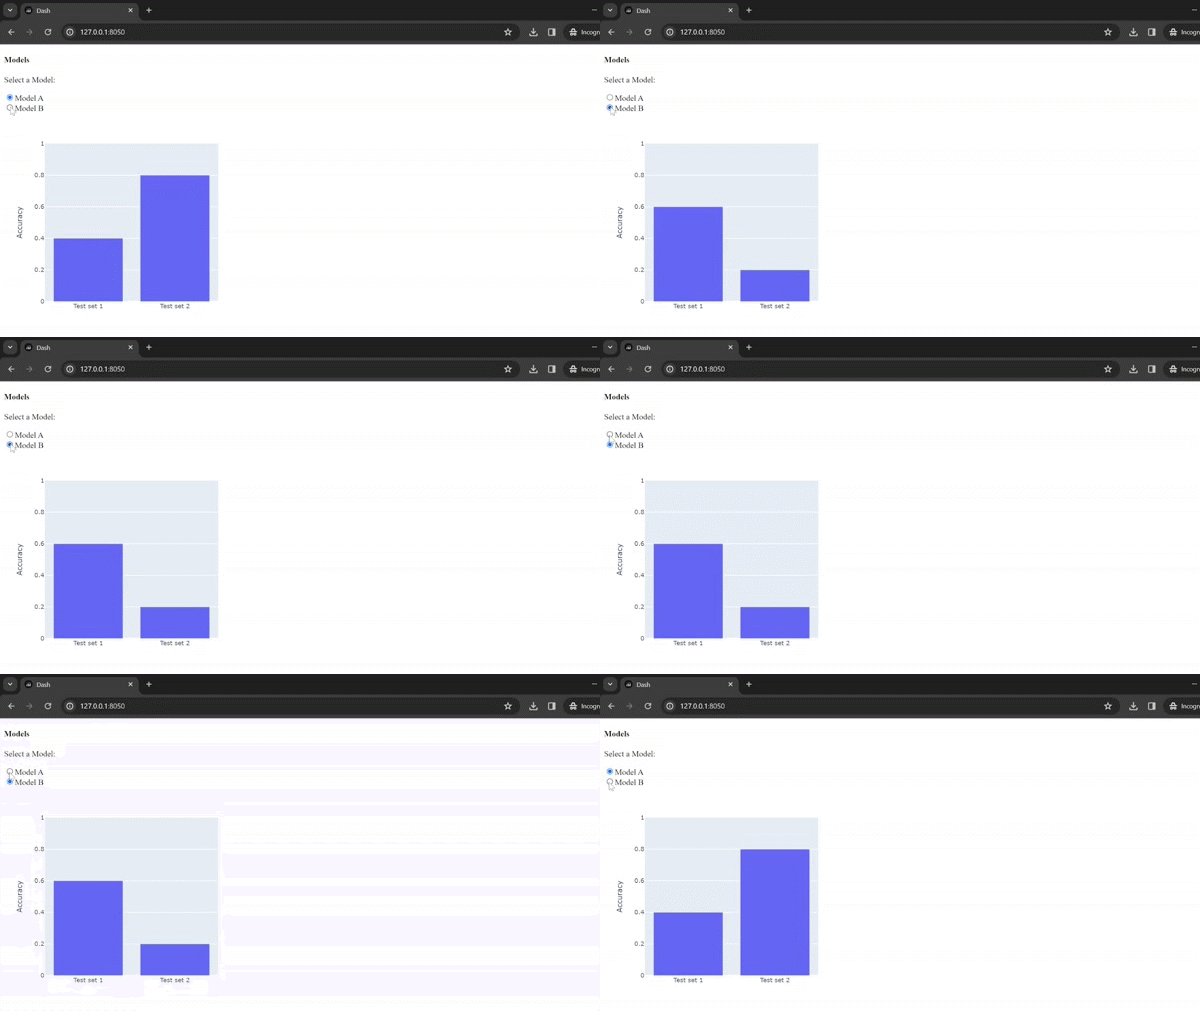
I’d like to display a bar chart that transitions to different values upon the click of a button (see the animated gif I created in Keynote as a demonstration).

Starting from the simple code below, how can I create such an animation?
import plotly.express as px
model1 = px.bar(x=["Test set 1", "Test set 2"], y=[0.4, 0.8], width=500)
# model2 = px.bar(x=["Test set 1", "Test set 2"], y=[0.6, 0.2], width=500)
model1.update_layout(xaxis_title="", yaxis_title="Accuracy", yaxis_range=[0,1])
model1.show()
# TODO: Add buttons that allow animated switch between model1 and model2.
Hi @markusdr ,
Welcome to the forum.
To create custom animation like that, I think you can do using Dash.
you can refer to this link below:
https://plotly.com/python/animations/#animated-figures-in-dash
And this example I try to put your simple code into animation using Dash Plotly and use radio buttons instead of regular button to trigger animation.
from dash import Dash, dcc, html, Input, Output
import plotly.express as px

modelA = px.bar(x=["Test set 1", "Test set 2"], y=[0.4, 0.8], width=500)
modelB = px.bar(x=["Test set 1", "Test set 2"], y=[0.6,0.2], width=500)

app = Dash(__name__)


app.layout = html.Div([
    html.H4('Models'),
    html.P("Select a Model:"),
    dcc.RadioItems(
        id='selection',
        options=["Model A", "Model B"],
        value='Model A',
    ),
    dcc.Loading(dcc.Graph(id="graph", figure=modelA), type="cube")
])


@app.callback(
    Output("graph", "figure"),
    Input("selection", "value"))
def display_animated_graph(selection):
    animations = {
        'Model A': modelA,
        'Model B': modelB,
    }
    animations[selection].update_layout(xaxis_title="", yaxis_title="Accuracy", yaxis_range=[0,1])
    return animations[selection]


app.run_server(debug=True)

Hope this help.

