I need to extend line at the end of graphics area, that is made with 2 DataFrame points with DatetimeIndex as on screen below:
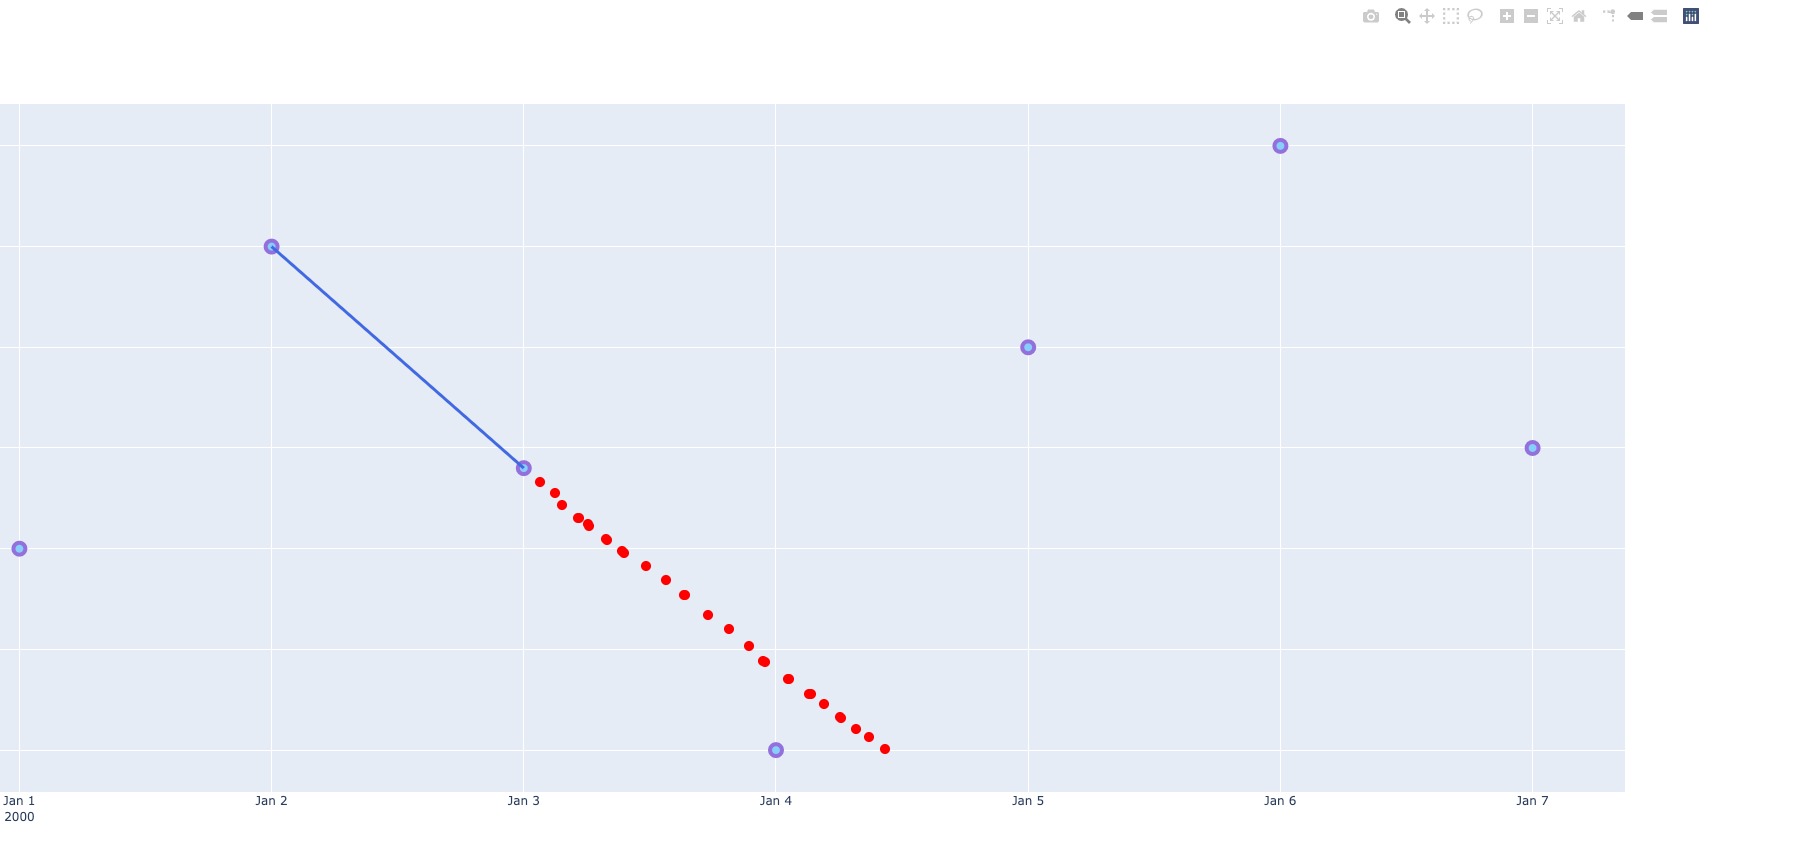
How to do that? With math I would calculate where line exactly hits x axis, buy it’s impossible, because you can not measure distance between Jan 4 and Jan 5, because it’s 1 day.
import pandas as pd
import plotly.graph_objects as go

df = pd.DataFrame({
    'score':[30, 60, 38, 10, 50, 70, 40],
    'date':['2000-01-01', '2000-01-02', '2000-01-03', '2000-01-04', '2000-01-05', '2000-01-06', '2000-01-07'],
})
df['date'] = pd.to_datetime(df['date'])

fig = go.Figure()
fig.add_shape(
    dict(
        type="line",
        x0=df.iloc[1]['date'],
        y0=df.iloc[1]['score'],
        x1=df.iloc[2]['date'],
        y1=df.iloc[2]['score'],
        line=dict(
        color="RoyalBlue",
        width=3
    )
))

fig.add_trace(
    go.Scatter(
        mode='markers',
        x=df['date'],
        y=df['score'],
        marker=dict(
            color='LightSkyBlue',
            size=12,
            line=dict(
                color='MediumPurple',
                width=4
            )
        ),
    )
)

fig.update_xaxes(tickmode='auto',)
fig.show()