How to share a graphs dataset with a dash DataTable

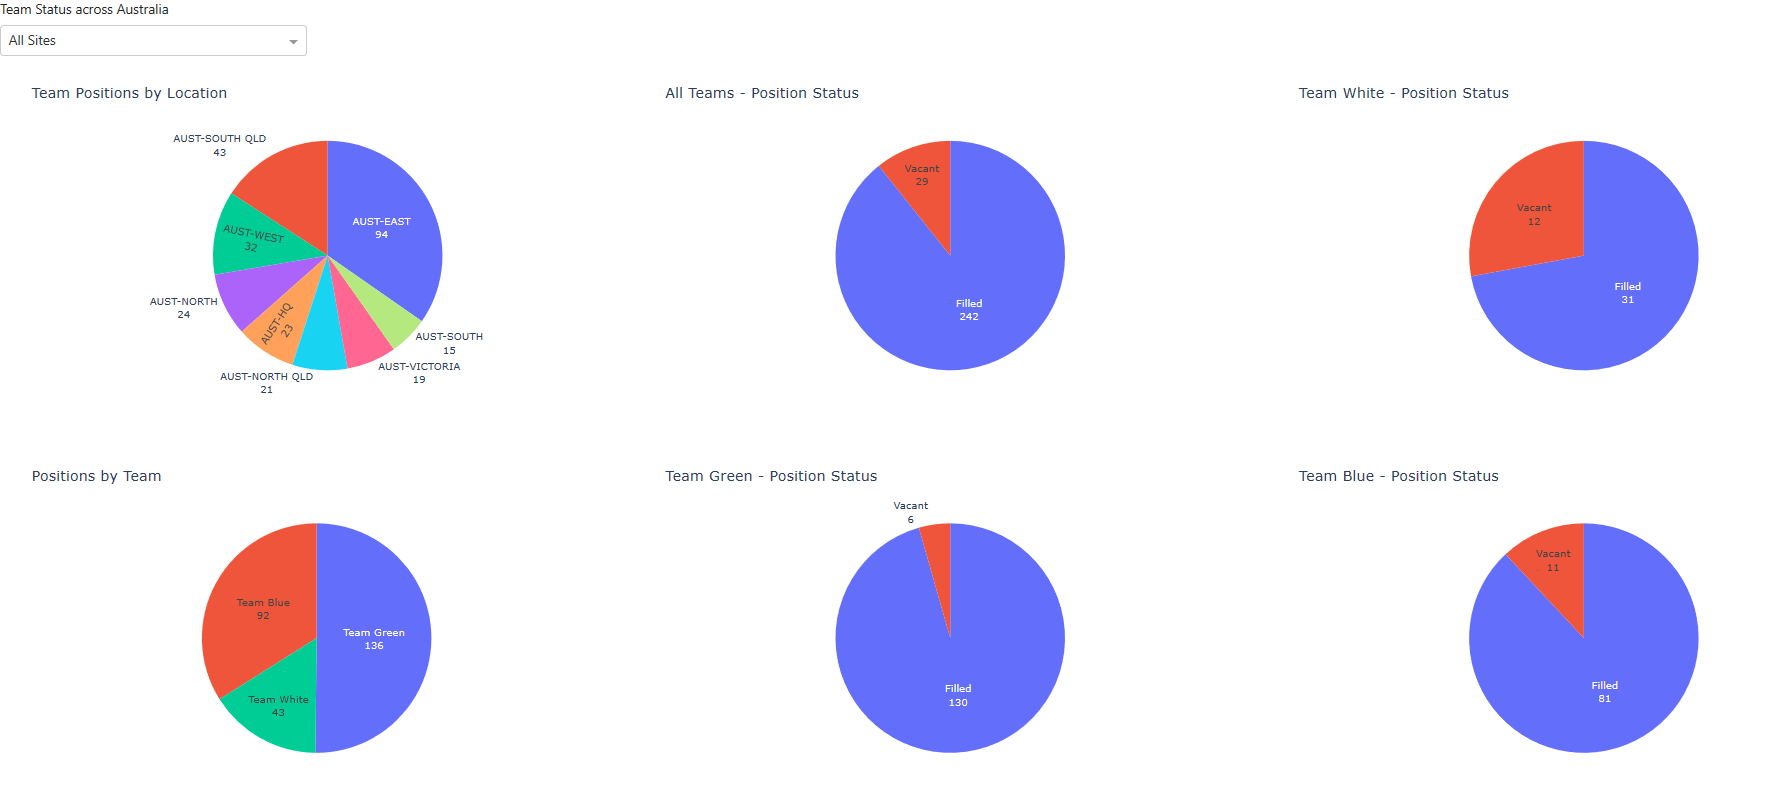
New to dash and have been trying to figure out how I can share the filtered (by dropdown) dataset for a graph with a datatable in a pop-up modal box. I have everything working for the first graph (top left) except I cannot figure out how to access the graphs dataset and share it with the dash_table.

The idea is that you select on a section of the graph and you get a pop up of the graphs underlying data, this can be further filtered by the drop down box.

Just an amateur so please excuse the poor coding.

import pandas as pd

import numpy as np

import dash

import dash_core_components as dcc

import dash_html_components as html

from dash.dependencies import Input, Output, State

import dash_bootstrap_components as dbc

import dash_table as dt

import plotly.express as px

import requests

from io import StringIO

import json

#  ---------------------Read data from google drive --------------------------------
orig_url = 'https://drive.google.com/file/d/1N0QtORHqG8aZ__ad6bLSHNOIUfFTKiDu/view?usp=sharing'

file_id = orig_url.split('/')[-2]

dwn_url = 'https://drive.google.com/uc?export=download&id=' + file_id

url = requests.get(dwn_url).text

csv_raw = StringIO(url)

df = pd.read_csv(csv_raw)


#  ---------------------Data Preparation --------------------------------

df['Qty'] = 1

df.columns = df.columns.str.replace(' ', '_')

ppmax = df.PayPeriod.max()

df = df[(df.PayPeriod == ppmax)]

df1 = df[['Unit_Description', 'Unit_Description2', 'Service', 'Status', 'Qty', 'PayPeriod']]

# below - create the 2 x N array to fil the drop down list

df2 = np.stack((np.append(['All Sites'], df['Unit_Description'].unique()),
                np.append(np.empty(shape=[1], dtype='str'), df['Unit_Description2'].unique())), axis=-1)

app = dash.Dash(external_stylesheets=[dbc.themes.BOOTSTRAP])

#  -------------------- Create HTML Page and Dropdown list --------------------------------

app.layout = html.Div([

    html.Div([

        html.Label(['Team Status across Australia']),

        dcc.Dropdown(

            id='my_dropdown',
            options=[{'label': i[0], 'value': i[1]} for i in df2], # fill dropdown with different value for label and value
            value='',
            multi=False,
            clearable=False,
            style={"width": "40%"}
        ),

    ]),
    #  ------------------------- position the graphs -----------------------
    html.Div([
        dcc.Graph(id='the_graph'),
        dcc.Graph(id='the_graph2'),
    ], style={'display': 'inline-block', 'width': '33%', 'height': '80%'}),
    html.Div([
        dcc.Graph(id='the_graph3'),
        dcc.Graph(id='the_graph4'),

    ], style={'display': 'inline-block', 'width': '33%', 'height': '80%'}),

    html.Div([
        dcc.Graph(id='the_graph5'),
        dcc.Graph(id='the_graph6'),

    ], style={'display': 'inline-block', 'width': '33%', 'height': '80%'}),

    html.Div(id='hover-data', style={'display':'none'}),

    html.Div([
        dbc.Modal(
            [
                dbc.ModalHeader("Header"),
                dbc.ModalBody(dt.DataTable(
                                id='table',
                                columns=[{"name": i, "id": i} for i in df1.columns],
                                data=df1.to_dict('records'),
                                )),
                dbc.ModalFooter(
                    dbc.Button("Close", id="close", className="ml-auto")
                ),
            ],
            id="modal",
            size='xl'
        ),
    ]),


])

# ---------------------------------------------------------------


@app.callback(

    Output(component_id='the_graph', component_property='figure'),

    [Input(component_id='my_dropdown', component_property='value'),
     Input(component_id='the_graph', component_property='clickData')
     ],
)
def update_graph(my_dropdown,clickData):

    ctx = dash.callback_context
    ctx_msg = json.dumps(ctx.triggered)

    if json.loads(ctx_msg)[0]['prop_id'] == 'the_graph.clickData':
        print(my_dropdown)
        print(json.loads(ctx_msg)[0]['prop_id'])
        print(json.loads(ctx_msg)[0]['value']['points'][0]['label'])


    piechart = px.pie(

            data_frame=df1[df1['Unit_Description2'].str.contains(my_dropdown)],

            names='Unit_Description',

            values='Qty',

            title='Team Positions by Location'

            )
    piechart.update_traces(textinfo='value + label', showlegend=False)


    return piechart

# ------------------------------------------------------------------------


@app.callback(

    Output(component_id='the_graph2', component_property='figure'),

    [Input(component_id='my_dropdown', component_property='value')]

)
def update_graph2(my_dropdown):

    piechart2 = px.pie(

            data_frame=df1[df1['Unit_Description2'].str.contains(my_dropdown)],

            names='Service',

            values='Qty',

            title='Positions by Team'

            )
    piechart2.update_traces(textinfo='value + label', showlegend=False) # percent or value

    return piechart2

#  ------------------------------------------------------------------------


@app.callback(

    Output(component_id='the_graph3', component_property='figure'),

    [Input(component_id='my_dropdown', component_property='value')]

)
def update_graph3(my_dropdown):

    piechart3 = px.pie(

            data_frame=df1[df1['Unit_Description2'].str.contains(my_dropdown)],

            names='Status',

            values='Qty',

            title='All Teams - Position Status'

            )
    piechart3.update_traces(textinfo='value + label', showlegend=False) # percent or value

    return piechart3

# ------------------------------------------------------------------------


@app.callback(

    Output(component_id='the_graph4', component_property='figure'),

    [Input(component_id='my_dropdown', component_property='value')]

)
def update_graph4(my_dropdown):

    piechart4 = px.pie(

            data_frame=df1[df1['Unit_Description2'].str.contains(my_dropdown) &
                           df1['Service'].str.contains('Team Green')],

            names='Status',

            values='Qty',

            title='Team Green - Position Status'

            )
    piechart4.update_traces(textinfo='value + label', showlegend=False)

    return piechart4

#  -------------------------------------------------------------------------


@app.callback(

    Output(component_id='the_graph5', component_property='figure'),

    [Input(component_id='my_dropdown', component_property='value')]

)
def update_graph5(my_dropdown):

    piechart5 = px.pie(

            data_frame=df1[df1['Unit_Description2'].str.contains(my_dropdown) &
                           df1['Service'].str.contains('Team White')],

            names='Status',

            values='Qty',

            title='Team White - Position Status'

            )
    piechart5.update_traces(textinfo='value + label', showlegend=False)

    return piechart5

# -------------------------------------------------------------------------


@app.callback(

    Output(component_id='the_graph6', component_property='figure'),

    [Input(component_id='my_dropdown', component_property='value')]

)
def update_graph6(my_dropdown):

    piechart6 = px.pie(

            data_frame=df1[df1['Unit_Description2'].str.contains(my_dropdown) &
                           df1['Service'].str.contains('Team Blue')],

            names='Status',

            values='Qty',

            title='Team Blue - Position Status'

            )
    piechart6.update_traces(textinfo='value + label', showlegend=False)

    return piechart6


@app.callback(
    Output("modal", "is_open"),
    [Input("close", "n_clicks"), Input('the_graph', 'clickData')],
    [State("modal", "is_open")],)
def toggle_modal(n1, cd, is_open):
    if n1 or cd:
        return not is_open
    return is_open


if __name__ == '__main__':

    app.run_server(debug=True)

So to find a solution I used dbc.Table and a blind div, as per the guides. The graph is now working with one annoying issue and that is a Callback error updating intermediate-value.children which is, I believe, related to the dropdown box. The error appears on the loading of the app and whenever the dropdown is used, however it doesn’t affect it’s functionality.

Any input or suggestions would be most welcomed.

import pandas as pd

import numpy as np

import dash

import dash_core_components as dcc

import dash_html_components as html

from dash.dependencies import Input, Output, State

import dash_bootstrap_components as dbc

import plotly.express as px

import requests

from io import StringIO

import json


#  ---------------------Read data from google drive --------------------------------

orig_url = 'https://drive.google.com/file/d/1N0QtORHqG8aZ__ad6bLSHNOIUfFTKiDu/view?usp=sharing'

file_id = orig_url.split('/')[-2]

dwn_url = 'https://drive.google.com/uc?export=download&id=' + file_id

url = requests.get(dwn_url).text

csv_raw = StringIO(url)

df = pd.read_csv(csv_raw)


#  ---------------------Data Preparation --------------------------------

df['Qty'] = 1

df.columns = df.columns.str.replace(' ', '_')

ppmax = df.PayPeriod.max()

df = df[(df.PayPeriod == ppmax)]

df1 = df[['Unit_Description', 'Unit_Description2', 'Service', 'Status', 'Qty', 'PayPeriod']]

# below - create the 2 x N array to fil the drop down list

df2 = np.stack((np.append(['All Sites'], df['Unit_Description'].unique()),
                np.append(np.empty(shape=[1], dtype='str'), df['Unit_Description2'].unique())), axis=-1)


app = dash.Dash(external_stylesheets=[dbc.themes.BOOTSTRAP])


#  -------------------- Create HTML Page and Dropdown list --------------------------------

app.layout = html.Div([

    html.Div([

        html.Label(['Team Status across Australia']),

        dcc.Dropdown(

            id='my_dropdown',
            options=[{'label': i[0], 'value': i[1]} for i in df2], # fill dropdown with different value for label and value
            value='',
            multi=False,
            clearable=False,
            style={"width": "40%"}
        ),

    ]),
    #  ------------------------- position the graphs -----------------------
    html.Div([
        dcc.Graph(id='the_graph'),
        dcc.Graph(id='the_graph2'),
    ], style={'display': 'inline-block', 'width': '33%', 'height': '80%'}),
    html.Div([
        dcc.Graph(id='the_graph3'),
        dcc.Graph(id='the_graph4'),

    ], style={'display': 'inline-block', 'width': '33%', 'height': '80%'}),

    html.Div([
        dcc.Graph(id='the_graph5'),
        dcc.Graph(id='the_graph6'),

    ], style={'display': 'inline-block', 'width': '33%', 'height': '80%'}),

    html.Div(id='hover-data', style={'display':'none'}),

    html.Div([
        dbc.Modal(
            [
                dbc.ModalHeader("Underlying Graph Data"),
                dbc.ModalBody(dbc.Table(id='table')),
                dbc.ModalFooter(
                    dbc.Button("Close", id="close", className="ml-auto")
                ),
            ],
            id="modal",
            size='xl'
        ),
    ]),

    html.Div(id='intermediate-value', style={'display': 'none'})

])

# ---------------------------------------------------------------


@app.callback(

    Output(component_id='the_graph', component_property='figure'),

    [Input(component_id='my_dropdown', component_property='value'),
     Input(component_id='the_graph', component_property='clickData')
     ],
)
def update_graph(my_dropdown,clickData):


    piechart = px.pie(

            data_frame=df1[df1['Unit_Description2'].str.contains(my_dropdown)],

            names='Unit_Description',

            values='Qty',

            title='Team Positions by Location'

            )
    piechart.update_traces(textinfo='value + label', showlegend=False)

    return piechart

# ------------------------------------------------------------------------


@app.callback(

    Output(component_id='the_graph2', component_property='figure'),

    [Input(component_id='my_dropdown', component_property='value')]

)
def update_graph2(my_dropdown):

    piechart2 = px.pie(

            data_frame=df1[df1['Unit_Description2'].str.contains(my_dropdown)],

            names='Service',

            values='Qty',

            title='Positions by Team'

            )
    piechart2.update_traces(textinfo='value + label', showlegend=False) # percent or value

    return piechart2

#  ------------------------------------------------------------------------


@app.callback(

    Output(component_id='the_graph3', component_property='figure'),

    [Input(component_id='my_dropdown', component_property='value')]

)
def update_graph3(my_dropdown):

    piechart3 = px.pie(

            data_frame=df1[df1['Unit_Description2'].str.contains(my_dropdown)],

            names='Status',

            values='Qty',

            title='All Teams - Position Status'

            )
    piechart3.update_traces(textinfo='value + label', showlegend=False) # percent or value

    return piechart3

# ------------------------------------------------------------------------


@app.callback(

    Output(component_id='the_graph4', component_property='figure'),

    [Input(component_id='my_dropdown', component_property='value')]

)
def update_graph4(my_dropdown):

    piechart4 = px.pie(

            data_frame=df1[df1['Unit_Description2'].str.contains(my_dropdown) &
                           df1['Service'].str.contains('Team Green')],

            names='Status',

            values='Qty',

            title='Team Green - Position Status'

            )
    piechart4.update_traces(textinfo='value + label', showlegend=False)

    return piechart4

#  -------------------------------------------------------------------------


@app.callback(

    Output(component_id='the_graph5', component_property='figure'),

    [Input(component_id='my_dropdown', component_property='value')]

)
def update_graph5(my_dropdown):

    piechart5 = px.pie(

            data_frame=df1[df1['Unit_Description2'].str.contains(my_dropdown) &
                           df1['Service'].str.contains('Team White')],

            names='Status',

            values='Qty',

            title='Team White - Position Status'

            )
    piechart5.update_traces(textinfo='value + label', showlegend=False)

    return piechart5

# -------------------------------------------------------------------------


@app.callback(

    Output(component_id='the_graph6', component_property='figure'),

    [Input(component_id='my_dropdown', component_property='value')]

)
def update_graph6(my_dropdown):

    piechart6 = px.pie(

            data_frame=df1[df1['Unit_Description2'].str.contains(my_dropdown) &
                           df1['Service'].str.contains('Team Blue')],

            names='Status',

            values='Qty',

            title='Team Blue - Position Status'

            )
    piechart6.update_traces(textinfo='value + label', showlegend=False)

    return piechart6

# -------------------------------------------------------------------------------------


@app.callback(
    Output("modal", "is_open"),
    [Input("close", "n_clicks"),
     Input('the_graph', 'clickData'),
     Input('the_graph2', 'clickData'),
     Input('the_graph3', 'clickData'),
     Input('the_graph4', 'clickData'),
     Input('the_graph5', 'clickData'),
     Input('the_graph6', 'clickData')
     ],
    [State("modal", "is_open")],)
def toggle_modal(n1, cd, cd2, cd3, cd4, cd5, cd6,  is_open):
    if n1 or cd or cd2 or cd3 or cd4 or cd5 or cd6:
        return not is_open
    return is_open


@app.callback(Output('intermediate-value', 'children'),
              [Input('my_dropdown', 'value'),
               Input('the_graph', 'clickData'),
               Input('the_graph2', 'clickData'),
               Input('the_graph3', 'clickData'),
               Input('the_graph4', 'clickData'),
               Input('the_graph5', 'clickData'),
               Input('the_graph6', 'clickData')
               ],)
def clean_data(value, c1, c2, c3, c4, c5, c6):

    df20 = df1[['Unit_Description', 'Unit_Description2', 'Service', 'Status']]
    df21 = df20[df20['Unit_Description2'].str.contains(value)]

    ctx = dash.callback_context
    ctx_msg = json.dumps(ctx.triggered)
    graph_num = json.loads(ctx_msg)[0]['prop_id']
    graph_value = json.loads(ctx_msg)[0]['value']['points'][0]['label']

    if graph_num == 'the_graph.clickData':
        return df21.to_json(date_format='iso', orient='split')
    elif graph_num == 'the_graph2.clickData':
        filtered_df2 = df21[(df21.Service == graph_value)]
        return filtered_df2.to_json(date_format='iso', orient='split')
    elif graph_num == 'the_graph3.clickData':
        filtered_df3 = df21[(df21.Status == graph_value)]
        return filtered_df3.to_json(date_format='iso', orient='split')
    elif graph_num == 'the_graph4.clickData':
        filtered_df4 = df21[(df21.Service == 'Team Green') & (df21.Status == graph_value)]
        return filtered_df4.to_json(date_format='iso', orient='split')
    elif graph_num == 'the_graph5.clickData':
        filtered_df5 = df21[(df21.Service == 'Team White') & (df21.Status == graph_value)]
        return filtered_df5.to_json(date_format='iso', orient='split')
    elif graph_num == 'the_graph6.clickData':
        filtered_df6 = df21[(df21.Service == 'Team Blue') & (df21.Status == graph_value)]
        return filtered_df6.to_json(date_format='iso', orient='split')
    else:
        return df20.to_json(date_format='iso', orient='split')


@app.callback(Output('table', 'children'), [Input('intermediate-value', 'children')])
def update_table(jsonified_filtered_df):

    my_dff = pd.read_json(jsonified_filtered_df, orient='split')

    table = dbc.Table.from_dataframe(my_dff, striped=True, bordered=True, hover=True)

    return table


# ----------------------------------------------------------------------------------------

app.config.suppress_callback_exceptions = True


if __name__ == '__main__':

    app.run_server(debug=True)


The errors were caused by:

a - Not setting one of my variables at startup, and
b - not filtering out the unwanted information from the dash.callback_context data.

All happy now.

import pandas as pd

import numpy as np

import dash

import dash_core_components as dcc

import dash_html_components as html

from dash.dependencies import Input, Output, State

import dash_bootstrap_components as dbc

import plotly.express as px

import requests

from io import StringIO

import json


#  ---------------------Read data from google drive --------------------------------

orig_url = 'https://drive.google.com/file/d/1N0QtORHqG8aZ__ad6bLSHNOIUfFTKiDu/view?usp=sharing'

file_id = orig_url.split('/')[-2]

dwn_url = 'https://drive.google.com/uc?export=download&id=' + file_id

url = requests.get(dwn_url).text

csv_raw = StringIO(url)

df = pd.read_csv(csv_raw)


#  ---------------------Data Preparation --------------------------------

df['Qty'] = 1

df.columns = df.columns.str.replace(' ', '_')

ppmax = df.PayPeriod.max()

df = df[(df.PayPeriod == ppmax)]

df1 = df[['Unit_Description', 'Unit_Description2', 'Service', 'Status', 'Qty', 'PayPeriod']]

# below - create the 2 x N array to fil the drop down list

df2 = np.stack((np.append(['All Sites'], df['Unit_Description'].unique()),
                np.append(np.empty(shape=[1], dtype='str'), df['Unit_Description2'].unique())), axis=-1)


app = dash.Dash(external_stylesheets=[dbc.themes.BOOTSTRAP])

app.config.suppress_callback_exceptions = True

#  -------------------- Create HTML Page and Dropdown list --------------------------------

app.layout = html.Div([

    html.Div([

        html.Label(['Team Status across Australia']),

        dcc.Dropdown(

            id='my_dropdown',
            options=[{'label': i[0], 'value': i[1]} for i in df2], # fill dropdown with different value for label and value
            value='',
            multi=False,
            clearable=False,
            style={"width": "40%"}
        ),

    ]),
    #  ------------------------- position the graphs -----------------------
    html.Div([
        dcc.Graph(id='the_graph'),
        dcc.Graph(id='the_graph2'),
    ], style={'display': 'inline-block', 'width': '33%', 'height': '80%'}),
    html.Div([
        dcc.Graph(id='the_graph3'),
        dcc.Graph(id='the_graph4'),

    ], style={'display': 'inline-block', 'width': '33%', 'height': '80%'}),

    html.Div([
        dcc.Graph(id='the_graph5'),
        dcc.Graph(id='the_graph6'),

    ], style={'display': 'inline-block', 'width': '33%', 'height': '80%'}),

    html.Div(id='hover-data', style={'display':'none'}),

    html.Div([
        dbc.Modal(
            [
                dbc.ModalHeader("Underlying Graph Data"),
                dbc.ModalBody(dbc.Table(id='table')),
                dbc.ModalFooter(
                    dbc.Button("Close", id="close", className="ml-auto")
                ),
            ],
            id="modal",
            size='xl'
        ),
    ]),

    html.Div(id='intermediate-value', style={'display': 'none'})

])

# ---------------------------------------------------------------


@app.callback(

    Output(component_id='the_graph', component_property='figure'),

    [Input(component_id='my_dropdown', component_property='value'),
     Input(component_id='the_graph', component_property='clickData')
     ],
)
def update_graph(my_dropdown,clickData):


    piechart = px.pie(

            data_frame=df1[df1['Unit_Description2'].str.contains(my_dropdown)],

            names='Unit_Description',

            values='Qty',

            title='Team Positions by Location'

            )
    piechart.update_traces(textinfo='value + label', showlegend=False)

    return piechart

# ------------------------------------------------------------------------


@app.callback(

    Output(component_id='the_graph2', component_property='figure'),

    [Input(component_id='my_dropdown', component_property='value')]

)
def update_graph2(my_dropdown):

    piechart2 = px.pie(

            data_frame=df1[df1['Unit_Description2'].str.contains(my_dropdown)],

            names='Service',

            values='Qty',

            title='Positions by Team'

            )
    piechart2.update_traces(textinfo='value + label', showlegend=False) # percent or value

    return piechart2

#  ------------------------------------------------------------------------


@app.callback(

    Output(component_id='the_graph3', component_property='figure'),

    [Input(component_id='my_dropdown', component_property='value')]

)
def update_graph3(my_dropdown):

    piechart3 = px.pie(

            data_frame=df1[df1['Unit_Description2'].str.contains(my_dropdown)],

            names='Status',

            values='Qty',

            title='All Teams - Position Status'

            )
    piechart3.update_traces(textinfo='value + label', showlegend=False) # percent or value

    return piechart3

# ------------------------------------------------------------------------


@app.callback(

    Output(component_id='the_graph4', component_property='figure'),

    [Input(component_id='my_dropdown', component_property='value')]

)
def update_graph4(my_dropdown):

    piechart4 = px.pie(

            data_frame=df1[df1['Unit_Description2'].str.contains(my_dropdown) &
                           df1['Service'].str.contains('Team Green')],

            names='Status',

            values='Qty',

            title='Team Green - Position Status'

            )
    piechart4.update_traces(textinfo='value + label', showlegend=False)

    return piechart4

#  -------------------------------------------------------------------------


@app.callback(

    Output(component_id='the_graph5', component_property='figure'),

    [Input(component_id='my_dropdown', component_property='value')]

)
def update_graph5(my_dropdown):

    piechart5 = px.pie(

            data_frame=df1[df1['Unit_Description2'].str.contains(my_dropdown) &
                           df1['Service'].str.contains('Team White')],

            names='Status',

            values='Qty',

            title='Team White - Position Status'

            )
    piechart5.update_traces(textinfo='value + label', showlegend=False)

    return piechart5

# -------------------------------------------------------------------------


@app.callback(

    Output(component_id='the_graph6', component_property='figure'),

    [Input(component_id='my_dropdown', component_property='value')]

)
def update_graph6(my_dropdown):

    piechart6 = px.pie(

            data_frame=df1[df1['Unit_Description2'].str.contains(my_dropdown) &
                           df1['Service'].str.contains('Team Blue')],

            names='Status',

            values='Qty',

            title='Team Blue - Position Status'

            )
    piechart6.update_traces(textinfo='value + label', showlegend=False)

    return piechart6

# -------------------------------------------------------------------------------------


@app.callback(Output('intermediate-value', 'children'),
              [Input('my_dropdown', 'value'),
               Input('the_graph', 'clickData'),
               Input('the_graph2', 'clickData'),
               Input('the_graph3', 'clickData'),
               Input('the_graph4', 'clickData'),
               Input('the_graph5', 'clickData'),
               Input('the_graph6', 'clickData')
               ],)
def clean_data(my_dropdown, c1, c2, c3, c4, c5, c6):

    df20 = df1[['Unit_Description', 'Unit_Description2', 'Service', 'Status']]
    df21 = df20[df20['Unit_Description2'].str.contains(my_dropdown)]

    ctx = dash.callback_context
    ctx_msg = json.dumps(ctx.triggered)
    graph_num = json.loads(ctx_msg)[0]['prop_id']
    graph_value = 'Initial Setting'

    if json.loads(ctx_msg)[0]['prop_id'][-9:] == 'clickData':
        graph_value = json.loads(ctx_msg)[0]['value']['points'][0]['label']

    if graph_num == 'the_graph.clickData':
        return df21.to_json(date_format='iso', orient='split')
    elif graph_num == 'the_graph2.clickData':
        filtered_df2 = df21[(df21.Service == graph_value)]
        return filtered_df2.to_json(date_format='iso', orient='split')
    elif graph_num == 'the_graph3.clickData':
        filtered_df3 = df21[(df21.Status == graph_value)]
        return filtered_df3.to_json(date_format='iso', orient='split')
    elif graph_num == 'the_graph4.clickData':
        filtered_df4 = df21[(df21.Service == 'Team Green') & (df21.Status == graph_value)]
        return filtered_df4.to_json(date_format='iso', orient='split')
    elif graph_num == 'the_graph5.clickData':
        filtered_df5 = df21[(df21.Service == 'Team White') & (df21.Status == graph_value)]
        return filtered_df5.to_json(date_format='iso', orient='split')
    elif graph_num == 'the_graph6.clickData':
        filtered_df6 = df21[(df21.Service == 'Team Blue') & (df21.Status == graph_value)]
        return filtered_df6.to_json(date_format='iso', orient='split')
    else:
        return df21.to_json(date_format='iso', orient='split')


@app.callback(Output('table', 'children'), [Input('intermediate-value', 'children')])
def update_table(jsonified_filtered_df):

    my_dff = pd.read_json(jsonified_filtered_df, orient='split')

    table = dbc.Table.from_dataframe(my_dff, striped=True, bordered=True, hover=True)

    return table


@app.callback(
    Output("modal", "is_open"),
    [Input("close", "n_clicks"),
     Input('the_graph', 'clickData'),
     Input('the_graph2', 'clickData'),
     Input('the_graph3', 'clickData'),
     Input('the_graph4', 'clickData'),
     Input('the_graph5', 'clickData'),
     Input('the_graph6', 'clickData')
     ],
    [State("modal", "is_open")],)
def toggle_modal(n1, cd, cd2, cd3, cd4, cd5, cd6,  is_open):
    if n1 or cd or cd2 or cd3 or cd4 or cd5 or cd6:
        return not is_open
    return is_open


# ----------------------------------------------------------------------------------------

if __name__ == '__main__':

    app.run_server(debug=True)