Hi guys,
I am having an issue when creating bar charts that plot over time (e.g. months)
If there are any months missing in my data set, this causes the chart to skip the months when plotting
From what I have read in the documentation, I need to be using the xaxis_range attribute to set the range to the complete list of months.
However, I am not sure what it means by:
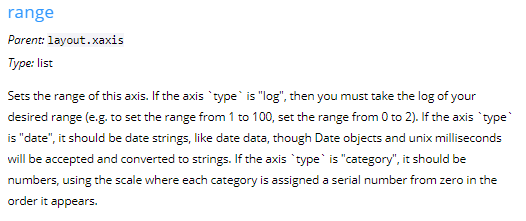
- If the axis
typeis “category”, it should be numbers, using the scale where each category is assigned a serial number from zero in the order it appears."
Also - any attempts I have made end up returning this error:
The 'range' property is an info array that may be specified as:

    * a list or tuple of 2 elements where:
(0) The 'range[0]' property accepts values of any type
(1) The 'range[1]' property accepts values of any type
Thanks for any help you can provide.
Greg