kabure
October 3, 2020, 9:34pm
1
Hey fellows,
I would like to change the ‘default’ frame of my animated chart and force it to use the last date as default when the Dash application is rendered. How can I do this?
import plotly.express as px

df = px.data.gapminder()

fig = px.scatter(df, x="gdpPercap", y="lifeExp", animation_frame="year", animation_group="country",
           size="pop", color="continent", hover_name="country",
           log_x=True, size_max=55, range_x=[100,100000], range_y=[25,90])
I’m trying something like it:
frame = -1
fig = go.Figure(fig.frames[frame].data, fig.frames[frame].layout)
fig
but it’s not showing the slider;
Could someone give me a direction on how I can I found references about it?
Dear Leonardo, @kabure
Always a pleasure to read your posts/questions.
If you have Plotly 1.10 or higher, you can use this to dig deep into the code:
fig = px.scatter(....
dev_fig = fig.full_figure_for_development()
print(dev_fig)
here’s what you need to do:
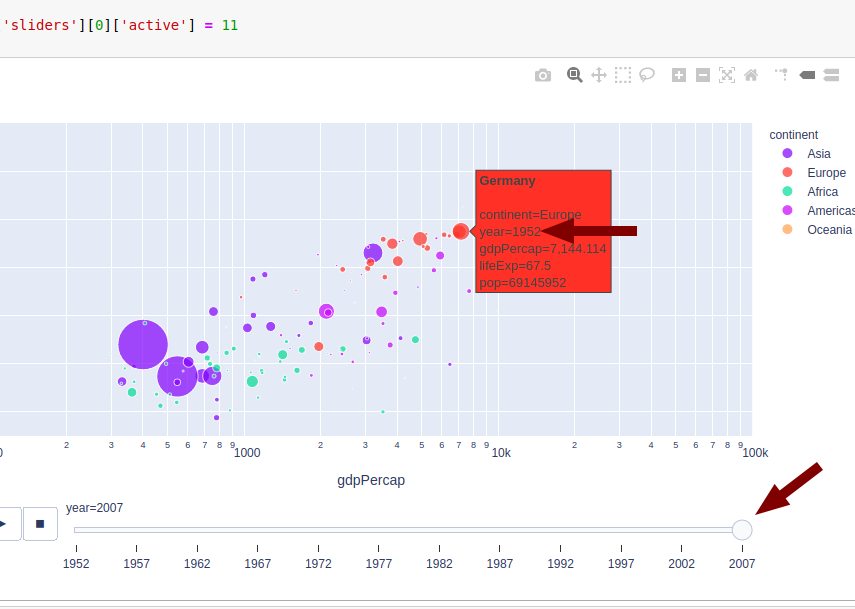
fig.layout['sliders'][0]['active'] = 11
fig.show()
because the 11th date is 2007. If you want it to start with 2002, assign 10 to ‘active’ instead of 11.
Kind regards,
kabure
October 4, 2020, 12:51am
3
Hey Adam, thank you very much for your support bro, I appreciate it;
I tried to implement your solution and the problem with the slider seems solved, but the data still on the first day;
import plotly.express as px

df = px.data.gapminder()

fig = px.scatter(df, x="gdpPercap", y="lifeExp", animation_frame="year", animation_group="country",
           size="pop", color="continent", hover_name="country",
           log_x=True, size_max=55, range_x=[100,100000], range_y=[25,90])

fig.layout['sliders'][0]['active'] = 11
fig.show()
Am I missing something?! Maybe, should I use the go.Figure(fig.frames[frame].data, fig.frames[frame].layout) before or after doing this, is it?
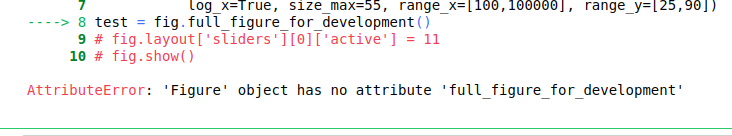
Also, I found interesting the "full_figure_for development()" idea and tried to use it, but it isn't working for me even with the plotly higher than 1.10;
After running it I get the error:
I would very grateful if you could give me more information about it;
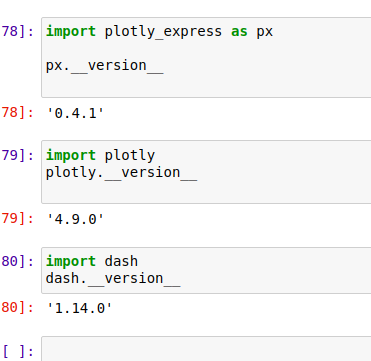
My bad Leonardo. It’s Plotly 4.10 .
Try it now and see what other values or attributes you can change deep inside the figure so it gives you the right label/year.
I’ll also try more tonight and let you know if I find the answer
kabure
October 4, 2020, 2:04am
5
Hey Adam, finally I discovered how to do it;
It will works!
import plotly_express as px

df = px.data.gapminder()

fig = px.scatter(df, x="gdpPercap", y="lifeExp", animation_frame="year", animation_group="country",
           size="pop", color="continent", hover_name="country",
           log_x=True, size_max=55, range_x=[100,100000], range_y=[25,90])

last_frame_num = int(len(fig.frames) -1)

fig.layout['sliders'][0]['active'] = last_frame_num

fig = go.Figure(data=fig['frames'][last_frame_num]['data'], frames=fig['frames'], layout=fig.layout)

fig
Thank you very much for the help bro, appreciate a lot