The table has 15 rows.
when show figure it looks like 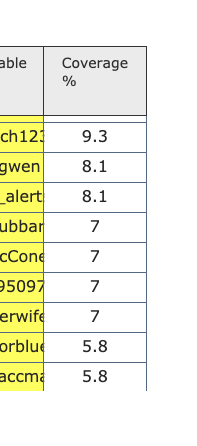
the figure has a toll-bar.
However, it just only kept top 9 rows when saved as pdf.

How can I save the complete figure?
the code is like this:
def FigTable (Mdf):
def Color(k):

    colors= ['rgba(0, 250, 0, 0.8)' if val in white else 'rgba(250, 0, 0, 0.8)' if val in fake else 'rgba(255, 255, 0, 0.8)'  for val in Data[k]]

    return colors
fig = make_subplots()
Mdf=Mdf.round(1)
Header=[list([Mdf.columns[i]]) for i in [0,1,3,4,6,7,9,10]]
Cols=[' '.join(Header[k][0].split(' ')[3:6]) for k in [0,2,4,6]]
[Cols.insert(i,'Coverage %') for i in [1,3,5,7]]
Data=[list(Mdf[Mdf.columns[i]]) for i in [0,3,6,9]]
Per=[list(Mdf.iloc[:,i]) for i in [1,4,7,10]]
DATA=reduce(add,Data)
fig.add_trace(go.Table( header = dict(height = 50,
                           values = Cols,
                           line = dict(color='rgb(50, 50, 50)'),
                           align = 'center',
                           font = dict(color=['rgb(45, 45, 45)'], size=14),
                           fill = dict( color = 'rgb(235, 235, 235)' )
                              ),
             cells = dict(values = [list(zip(Data,Per))[i][j] for i in range(0,4) for j in range(0,2)] ,
                          line = dict(color='#506784'),
                          align = 'center',
                          font = dict(color=['rgb(40, 40, 40)'], size=16),
                          height = 30,
                          fill = dict(color=
                         [Color(0),'rgba(0, 0, 250, 0)',Color(1), 'rgba(0, 0, 250, 0)',Color(2),
                          'rgba(0, 0, 250, 0)',Color(3), 'rgba(0, 0, 250, 0)']
                                         ))))

fig.update_layout(
    dict( width=1850,
    title=title,
    showlegend=False))

fig.write_image('name.pdf')