How can I reduce du width of the bars of a bar chart please (in red) ? Also I would like to reduce the space between those bars (in orange)
My code is :
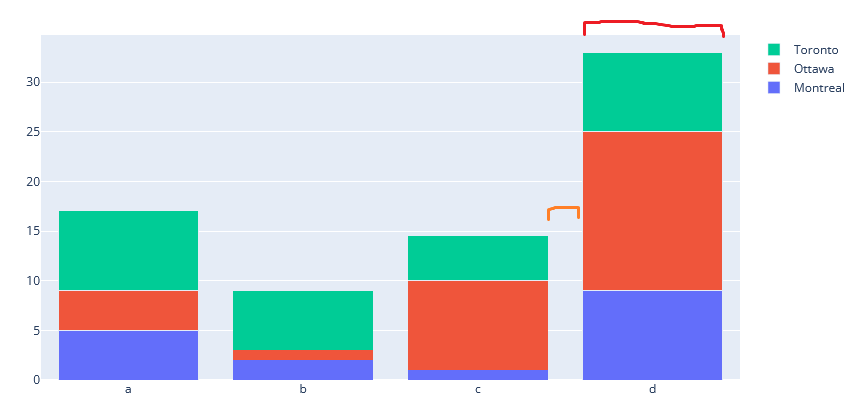
import plotly.graph_objects as go
x=['b', 'a', 'c', 'd']
fig = go.Figure(go.Bar(x=x, y=[2,5,1,9], name='Montreal'))
fig.add_trace(go.Bar(x=x, y=[1, 4, 9, 16], name='Ottawa'))
fig.add_trace(go.Bar(x=x, y=[6, 8, 4.5, 8], name='Toronto'))

fig.update_layout(barmode='stack', xaxis={'categoryorder':'category ascending'})
fig.show()
Thank you.
Hi,
You can use fig.update_layout(bargap=...) to set the gap between bars. This will automatically reduce the width. You can in principle update the width with fig.update_traces(width=...), however I am not sure how it scales with categorical data.
Hi, thank you for the help !
It works partially : with bargap it reduces the width of the bars which is good, however the gap between them doesn’t change :
I think the only option to reduce both the bar and gap width is to set a bar width with @jlfsjunior’s mention and then reduce the size of your plot with fig.update_layout(width = ...).
It kinda sounds counter-intuitive to reduce both the bar and gap width while keeping the same plot size.