Is it possible to configure this chart so that these legends appear in two columns, one column per group?
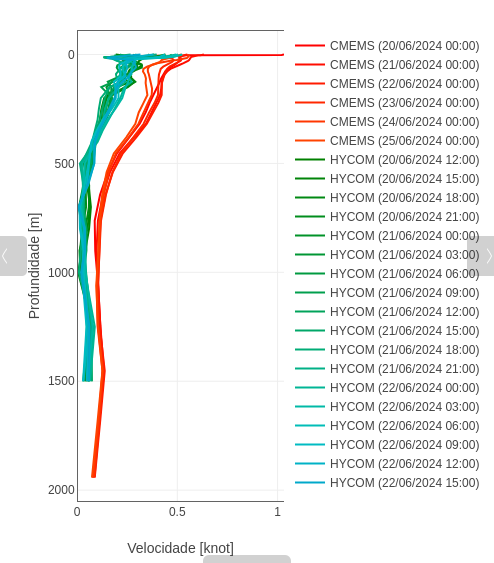
I think it would be better if you had a label per graph color and in the hoverinfo the data of the date and time of the graph were shown and then you wouldn’t have so many values in the legends and it would look better, remember less is more, but if you decide to continue with Your madness, I recommend that you use subplots one on top of the other so each subplot will have its own area of legends and you would only have to position them, but hey, here I leave you what you want