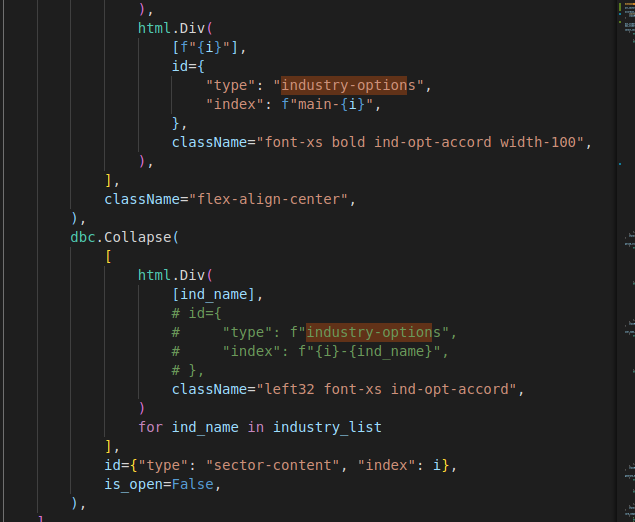
I’m working on a web app that has an advanced accordion style with some effects that I’m using pattern match callbacks on the engine to create the effects you can see on the gif below:
The problem starts when I try to add more categories and subcategories… So it starts to work very slow;
I’m trying to use 7 different categories with 30± subcategories in each category.
I thought the problem was about the loops to create the style and other information but after exploring the callback graph I did note that maybe other parts are being affected by this collapsed part;
I have isolated the component and created an application to test it:
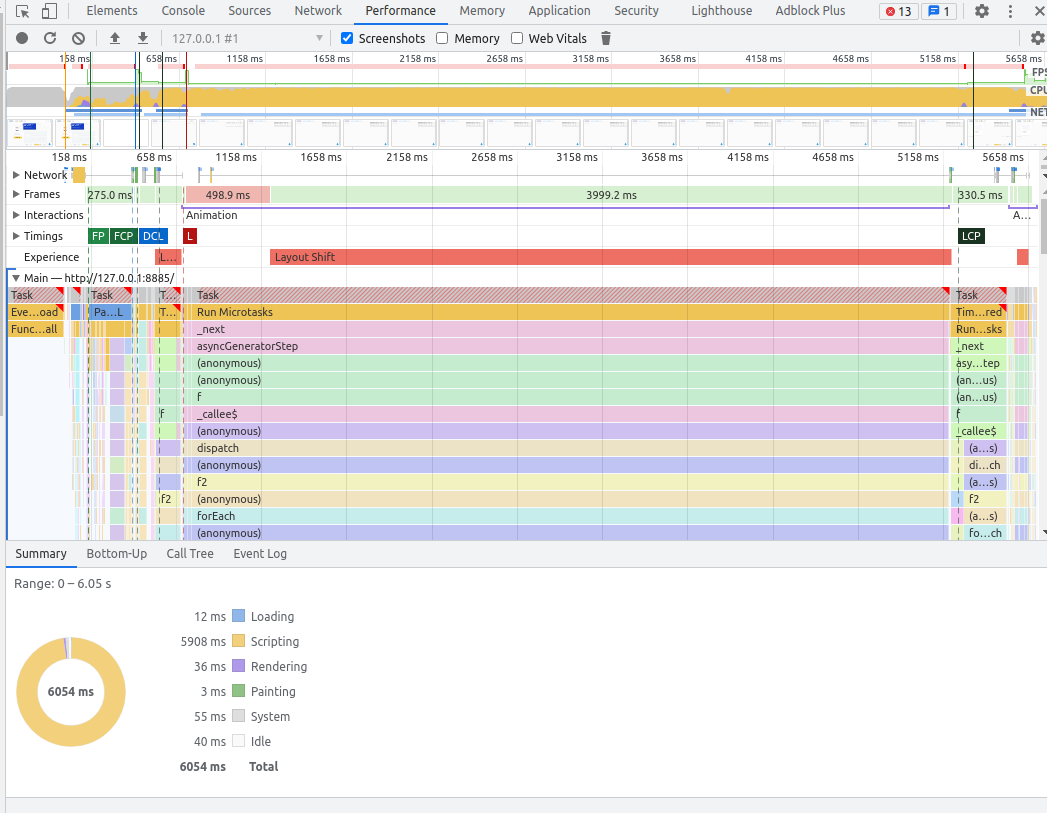
As we can see, it takes some time to run the component, but on the callback graph it says that it was very fast;
So, I would like to know what’s the best way to understand what’s happening on my callbacks to detect where is my bottleneck; I suspect that it’s not directly on the loops and so on, but it’s happening because it takes some time until rendering the modifications to the user.
Any help or reference would be very welcome.
If you need any other clarification please let me know.
Hm, could you try using Chrome’s built-in performance tools and share a screenshot of the results? It’s possible this is within Dash’s JS rather than in your code. Chrome’s performance / dev tools would probably tell us
I have created some checkpoints on my script and seems that my click is being recognized very fast, but it takes some time to propagate the info between the callbacks;
Please, let me know if I provided you the correct info otherwise, I can send it again.
Any light about how to solve it will be very welcome bro;
Last thing, If needed, I can provide you the component code to be easier to you reproduce it on your side and understand what’s going wrong;