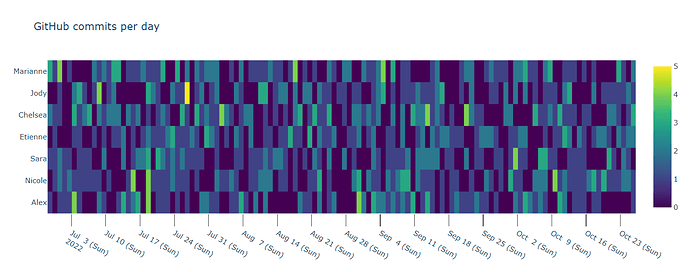
I am trying to format my x-axis ticks to show only “Mondays” on a series of graphs. The example below is an MRE but it is not what I am directly working on, but it is close enough (plotly example from Heatmaps in Python). Now I know these graphs can zoomed in and out, but I am wondering if when it shows a range of about 4 months or 120 days on the graph, how can I configure this graph to show Mondays by default, rather than Sundays?
I almost had it by setting “tick0=‘2022-07-04’” which is a Monday and setting “dtick=604800000” which did give me the desired output, but upon zoomning in it did not show days, hours, minutes, or seconds which is a feature I am still desiring. Does anyone have a solution for this?
import plotly.graph_objects as go
import datetime
import numpy as np
np.random.seed(1)

programmers = ['Alex','Nicole','Sara','Etienne','Chelsea','Jody','Marianne']

base = datetime.datetime.today()
dates = base - np.arange(120) * datetime.timedelta(days=1)
z = np.random.poisson(size=(len(programmers), len(dates)))

fig = go.Figure(data=go.Heatmap(
        z=z,
        x=dates,
        y=programmers,
        colorscale='Viridis'))

fig.update_layout(
    title='GitHub commits per day',
    xaxis_nticks=36)

fig.update_xaxes(showgrid=True, gridwidth=2, gridcolor='white', type='date',
    rangeslider_visible=False, ticks='outside', tickson='boundaries', ticklen=20,
    tickformatstops = [
        dict(dtickrange=[None, 1000], value="%H:%M:%S.%L\n%b %e %Y"),
        dict(dtickrange=[1000, 60000], value="%H:%M:%S\n%b %e %Y"),
        dict(dtickrange=[60000, 3600000], value="%H:%M\n%b %e %Y"),
        dict(dtickrange=[3600000, 86400000], value="%b %e (%a)\n%Y"),
        dict(dtickrange=[86400000, 604800000], value="%b %e (%a)\n%Y"),
        dict(dtickrange=[604800000, "M1"], value="%b %e (%a)\n%Y"),
        dict(dtickrange=["M1", "M12"], value="%B\n%Y"),
        dict(dtickrange=["M12", None], value="%Y")]
    )

fig.show()
