I encountered this post Trying to make a uniform colorscale for each of the subplots and wonder if one can do the same as the solution there if one is using px (instead of go)?
Consider the code below:
data = {
    'start': ['2023-01-01', '2023-02-01', '2023-03-01'],
    'category': ['month', 'year', 'year'],
    'duration': [5, 10, 15,]
}
data2 = {
    'start': ['2023-02-01', '2023-03-01', '2023-04-01'],
    'category': ['year', 'year', 'month'],
    'duration': [5, 10, 15]
}
df = pd.DataFrame(data)
df2 = pd.DataFrame(data2)

fig = make_subplots(rows=2, cols=1, shared_xaxes=True)
fig1 = px.bar(df, x='start', y="duration", color='category', orientation='h', color_discrete_sequence=px.colors.qualitative.Vivid)
for trace in fig1.data:
    fig.add_trace(trace, 1, 1)

fig2 = px.bar(df2, x='start', y="duration", color='category', orientation='h', color_discrete_sequence=px.colors.qualitative.Vivid)
for trace in fig2.data:
    fig.add_trace(trace, 2, 1)

fig.show()
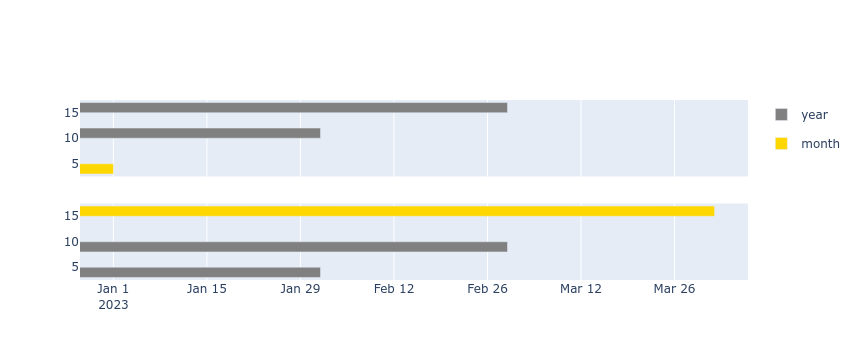
How can I make sure that year bars are the same color in both subplots? Or, do I have to write a manual mapping? If one must do manual mapping, is there a way to map all existing categorical values (e.g., month and year etc) to an existing color sequence like Vivid? But perhaps there’s an easier way?