How to make a Logarithmic color scale in my Choropleth map

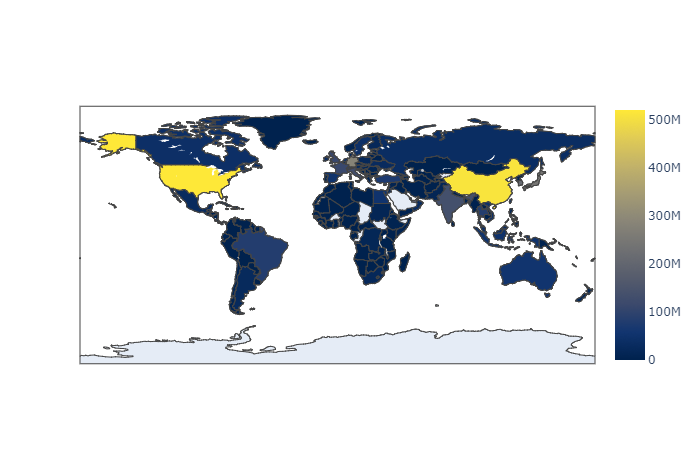
Hi i have a choropleth map for the world most of the countries in this map have similar values except
China and the U.S.A so most of the countries have the same color
how can i make a Logarithmic color scale to pass this problem

THIS IS MY CODE

fig = go.Figure()

fig.add_choropleth(locations=df['countery_name_iso'],
                   z=df['value'],
                   text=df['countery_name_iso'],
                   colorscale='cividis',
                   autocolorscale=False,
                   reversescale=False)
fig.show()

1 Like

Hi @mahmoud you can put z=np.log10(df['value']) (importing numpy) to plot the log10 of your values. If you would like the colorbar to display the original values you can use tickprefix as in https://plot.ly/python/datashader/#exploring-correlations-of-a-large-dataset.

1 Like

@Emmanuelle: this sort of works, but when you hover over the region, it now shows things like 2 (for 100). This is ok as far as it goes, but most people aren’t very good at converting from the log of n back to n. I wonder if there is a way show the color scale logarithmically, but when we hover (and the colorbar) it shows the actual numbers? This is how it works, for instance, when you change the y-axis to log in a scatter/line plot. It seems much more natural and intuitive.

One thing I did was to just add the data using text:
text = df['value']

This works great. The only thing is it would be nice if the colorbar matched it.

To get the colorbar to match it I just adjusted the colorbar properties (customize as you see fit):

    colorbar=dict(len=0.75,
                  title='#Cases', 
                  x=0.9,
                  tickvals = [0, 1, 2, 3, 3.699, 4],
                  ticktext = ['1', '10', '100', '1000', '5000','10000'])
1 Like

thank you very much .

I agree your workaround work passing by canvas, but don’t understand why there is no simpler option on Histogram2dContour just change the color scale to take logarithmic scale boundaries. Looks for me more elegant and proper solution.

Hi @eric_overflow welcome to the forum! You can in fact pass other numerical data to the customdata argument of go.Choropleth and modify the hovertemplate to use the original data (eg 100, 1000) instead of their log10 which is used for z. See for example https://plotly.com/python/hover-text-and-formatting/#adding-other-data-to-the-hover-with-customdata-and-a-hovertemplate for using customdata in a hovertemplate.

1 Like