Hello everyone
I am trying to display a power system with lines and nodes on a map using mapbox. Several problems I have encountered:
- How to connect the bubbles on the map with a line with arrows other using mode=‘markers+lines’?
- How to make the line flow and change the thickness when updating the data in the @app.callback?
- How to ensure that the line stays linked when the map is zoomed in or out?
- How to plot half-pie charts in the bubble shown in the follow fig (I wish to display my map just as this in a pure Dash enviroment).

Unfortunately, the graphics I draw are as follows:
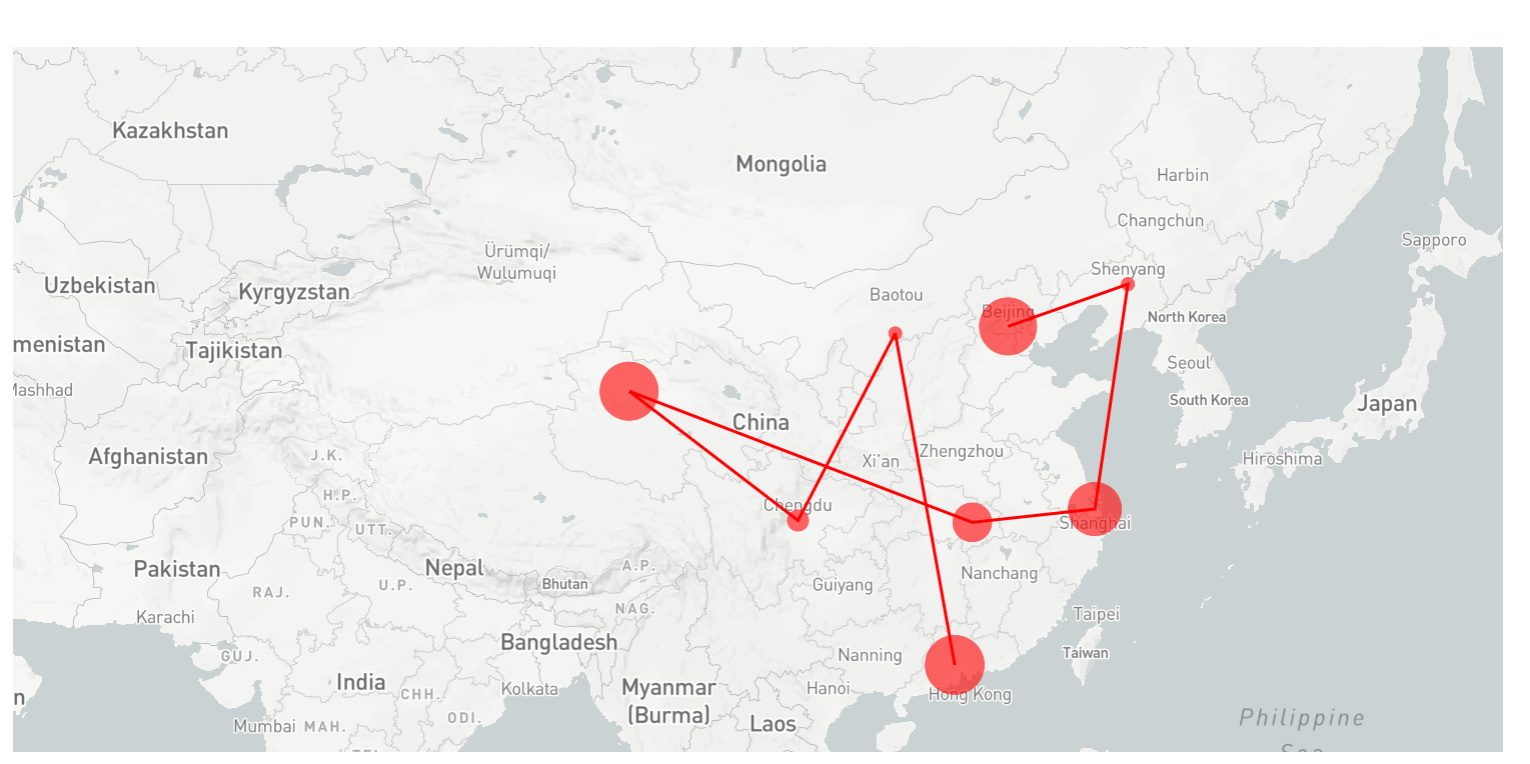
I really hope someone can help me and figure it out in a relatively simple way.