Please tell me how can I implement several charts on one page? I’m in the process of learning the Dash framework and so far I have been able to run the example on test data, but only one graph. (like in the screenshot)

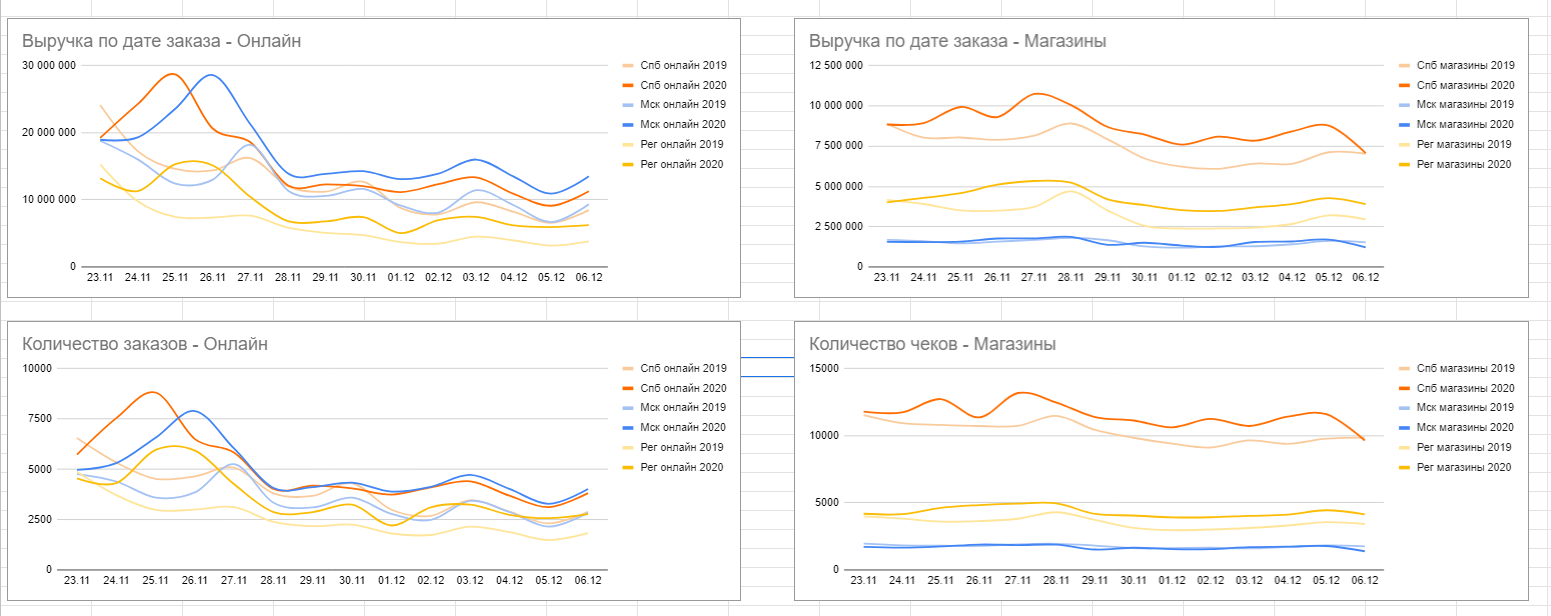
And I need to implement several graphs, something like this: (see screenshot)
is there a link to a tutorial or guide? Thx