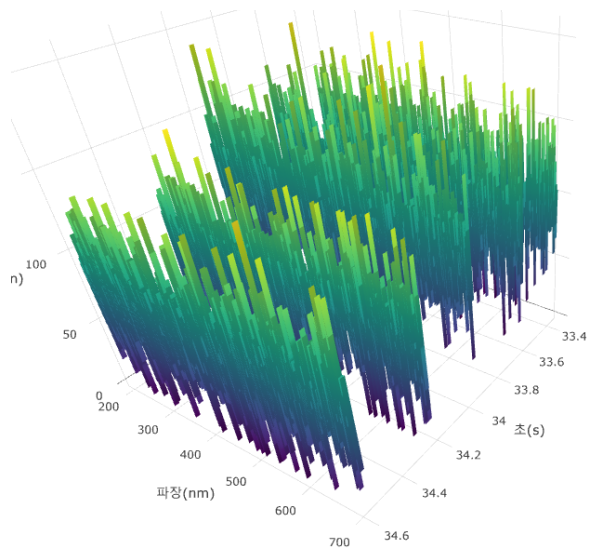
I made some chart seeing documentation ‘Ribon plot’ .
there are five trace in that chart.
you can also see five traces in this picture.
If i hover that one, one of the trace that i hover , i want to see some data in the trace
May i give some answer.
Here is my code. in JS
data1 is data in ajax success
the data;s type is Map<String, ArrayList> in java , i send the data in spring, @ResponseBody
x_oesData = data1.x_data;
y_oesData = data1.y_data;
z_oesData = data1.z_data;
for(var i = 0;i<5;i++){
var x_temp = Array();
var y_temp = Array();
var z_temp = Array();
for(var j=i*1024;j<(i+1)*1024;j++){
var x_temp_temp = new Array();
x_temp.push([(x_oesData[j]-0.01),(x_oesData[j]+0.01)]);
y_temp.push([y_oesData[j],y_oesData[j]]);
z_temp.push([z_oesData[j],z_oesData[j]]);
			}
			x.push(x_temp);
			y.push(y_temp);
			z.push(z_temp);
		}

		chartdata=[];
		for(var i=0;i<x.length;i++){
			var trace1 = {
					  x:x[i], y:y[i], z:z[i],
					  name: '',
					  colorscale: 'Viridis',
					  type: 'surface',
				      showscale: false
				  };
			chartdata.push(trace1);
		}
		myPlot = document.getElementById('ThreeD_chart'),
		data = chartdata,
		layout = {
				scene: {
					xaxis:{title: 'second(s)'},
					yaxis:{title: 'wavelenth(nm)'},
					zaxis:{title: 'somthing(hmm)'},
					},
				  title: 'OES',
				  hovermode: 'closest',
				  showlegend: false,
				  autosize: true,
				  width: 1280,
				  height: 800,
				  margin: {
				    l: 65,
				    r: 50,
				    b: 65,
				    t: 90,
				  }
				};
		Plotly.newPlot('ThreeD_chart',chartdata,layout);