How to "hidde" a chart, figure, html.Div

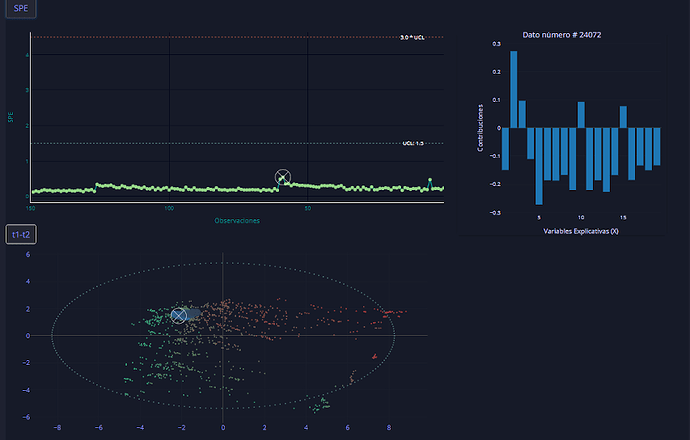
I don’t know how to hide a chart. Really, I need to change, for example, two charts for another one as you can see in the figures attached.

I’d like to change from this layout

to this one

using the PUSH ME button, for example.

My example code is this one… without a valid Callback :frowning:

import dash
import dash_core_components as dcc
import dash_html_components as html
import dash_bootstrap_components as dbc
from dash.dependencies import Input, Output, State
from dash.exceptions import PreventUpdate


external_stylesheets=[dbc.themes.BOOTSTRAP]

app = dash.Dash(__name__, external_stylesheets=external_stylesheets)

app.layout = html.Div(className="container",children=[

    
    html.Div(id='main-div',className='row',children=[
 

        ]),
        html.Div(className='col-12',children=[
            dcc.Graph(
                id='example-graph3',
                figure={
                    'data': [
                        {'x': [1, 2, 3], 'y': [11, 22,44], 'type': 'bar', 'name': 'SF'},
                        {'x': [1, 2, 3], 'y': [2, 25, 12], 'type': 'bar', 'name': 'NYC'},
                    ],
                    'layout': {
                        'title': 'GRAPH3'
                    }
                }
            )
        ]),  
        html.Div(className="row",children=[
        dbc.Button("Push me", id="mybutton")    
    ]),])


@app.callback(Output('main-div','className'),
              [Input('mybutton','n_clicks')]
              )
def mycallback(n_clicks):
    if n_clicks is None:
        raise PreventUpdate
    return "row"

if __name__ == '__main__':
    app.run_server(debug=False)

Thank you in advance for your help

Hi @pharizna

The easiest way is to use tabs. See a great example here:
https://dash.plotly.com/dash-core-components/tabs

Thank you but it’s not good for me.

Really, in this example I have only two charts but in the real Dashboard there are other two ‘static’ charts exchanging data and only two new ones disappearing or not.

I began with tabs but apparently it’s not good for the operator to have to choose between tabs in order to have only a 20-30% of new info

Hi @pharizna,

what you could do is to create a callback which would populate your html.Div(id='main-div', ...) with either a single html.Div (with one graph) or with two html.Divs (with two graphs). The callback would look something like this: (I suggest using e.g. dcc.RadioItems to switch between single- or double-graph layout, but you could also use a button or something else.)

@app.callback(Output('main-div',  'children'),
              [Input('my-radio-items', 'value')]
              )
def mycallback(layout):
    if layout == 'single_column':
        children = [
            html.Div(className='col-12',children=[
                dcc.Graph(...)
            ])
        ]

    elif layout == 'two_columns':
        children = [
            html.Div(className='col-6',children=[
                dcc.Graph(...)
            ]),
            
            html.Div(className='col-6',children=[
                dcc.Graph(...)
            ])
        ]
    return children

Thank you @sislvacl,

It’s fine!