Hi Team,
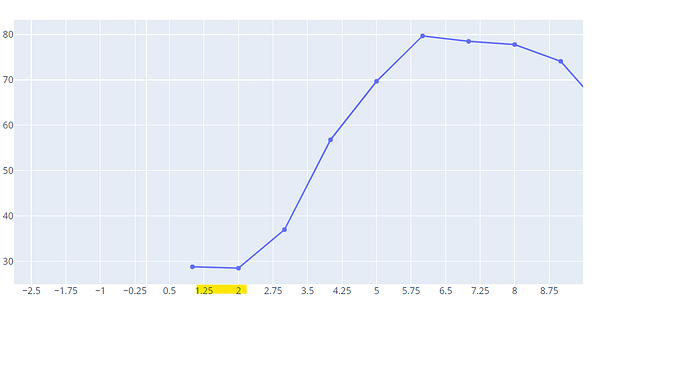
My question is regarding how we can expanded , compress the axes (with number). I’m sharing a screenshot for reference of trading view charts.
hi @rohit
![]() Welcome to the community.
Welcome to the community.
Do you mean, how one would add or reduce the amount of tick values on the x axis?
Something like this? If "linear", the placement of the ticks is determined by a starting position tick0 and a tick step dtick
Hi @adamschroeder
No, In below screenshot you can x-axis values (1.25 to 2). I want to extend this values to (1.25 , 126,… 2.0) without adding value in this range.
I want a kind of scroll… So, that I can go to more deep in the values and vice versa(compress).
You can also refer to tradingview. in tradingview we have x and y axis that you can stretch and compress.
Regards,
Rohit Ojha
hi @rohit
It looks like you’re trying to dynamically set the axis values based on zoom level? I don’t think that’s possible out of the box with plotly express.
Not sure I 100% understand the question but here’s what I get:
Have you tried to click and drag on the chart area? That should allow you to zoom to a box, zoom on the x axis and zoom on the y axis. Then you can double click on the chart to get back to the base state.
Another way is to click and drag the x/y axis from their extremity to change their range.

