Hi everyone,
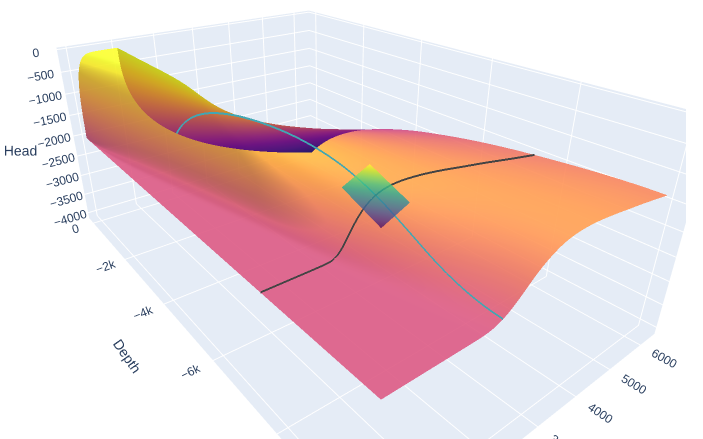
I’m working on a real-time visualization where I dynamically display the tangent plane of a surface at the point currently hovered by the mouse. Ideally, I want this to be as smooth and responsive as the built-in surface.contours feature.
Here is an exemple:
What I’ve Tried So Far
- Server-Side Callback (Patch Update on Second Trace)
- The latency made the plot lag, which isn’t ideal for real-time interactions.
- Client-Side Callback (Modifying
figure.dataand Incrementingdatarevision)
- But the tangent plane didn’t update properly.
- Deep Copying the Figure (
JSON.parse(JSON.stringify(figure)))
- This worked, but it was too slow (likely due to full redraw).
- Using
Plotly.restyleto Update Only the Second Trace
- Expected it to be more efficient, but it performs like the server-side patch based on callback execution time.
Current Code Implementation
- First Attempt: Updating figure.data and datarevision
app.clientside_callback(
    """
    function(hoverData, dz_dx, dz_dy, figure) {
        if (!figure || !figure.data || figure.data.length < 2) {
            return window.dash_clientside.no_update;
        }

        if (hoverData && dz_dx && dz_dy) {
            var xi = hoverData.points[0].x;
            var yi = hoverData.points[0].y;

            var x_idx = Math.round(xi / 5);
            var y_idx = Math.round(yi / 10);

            var dz_dx_val = dz_dx[y_idx][x_idx];
            var dz_dy_val = dz_dy[y_idx][x_idx];
            var z0 = hoverData.points[0].z;

            var Dx = 315, Dy = 315;
            var xpt = [-Dx + xi, xi, Dx + xi];
            var ypt = [-Dy + yi, yi, Dy + yi];

            var x_grid = [], y_grid = [], z_grid = [];
            for (var i = 0; i < 3; i++) {
                for (var j = 0; j < 3; j++) {
                    var x_val = xpt[i];
                    var y_val = ypt[j];
                    x_grid.push(x_val);
                    y_grid.push(y_val);
                    z_grid.push(z0 + dz_dx_val * (x_val - xi) + dz_dy_val * (y_val - yi));
                }
            }

            var x_grid_2d = [x_grid.slice(0, 3), x_grid.slice(3, 6), x_grid.slice(6, 9)];
            var y_grid_2d = [y_grid.slice(0, 3), y_grid.slice(3, 6), y_grid.slice(6, 9)];
            var z_grid_2d = [z_grid.slice(0, 3), z_grid.slice(3, 6), z_grid.slice(6, 9)];

            figure.data[1].z = z_grid_2d;
            figure.data[1].x = x_grid_2d;
            figure.data[1].y = y_grid_2d;

            if (!figure.layout.datarevision) {
                figure.layout.datarevision = 0;
            }
            figure.layout.datarevision += 1;

            return figure;
        }
        return window.dash_clientside.no_update;
    }
    """,
    Output('3d-plot', 'figure'),
    Input('3d-plot', 'hoverData'),
    State('store-dz-dx', 'data'),
    State('store-dz-dy', 'data'),
    State('graph', 'figure')
)
- Second Attempt: Using
Plotly.restylefor Faster Updates
app.clientside_callback(
    """
    function(hoverData, dz_dx, dz_dy, figure) {
        console.time('update_tangent_plane');
        if (!figure || !figure.data || figure.data.length < 2) {
            console.timeEnd('update_tangent_plane');
            return window.dash_clientside.no_update;
        }

        if (hoverData && dz_dx && dz_dy) {
            var xi = hoverData.points[0].x;
            var yi = hoverData.points[0].y;

            var x_idx = Math.abs(Math.round(xi / 5));
            var y_idx = Math.abs(Math.round(yi / 10));

            var dz_dx_val = dz_dx[y_idx][x_idx];
            var dz_dy_val = dz_dy[y_idx][x_idx];
            var z0 = hoverData.points[0].z;

            var Dx = 315, Dy = 315;
            var xpt = [-Dx + xi, xi, Dx + xi];
            var ypt = [-Dy + yi, yi, Dy + yi];

            var x_grid = [], y_grid = [], z_grid = [];
            for (var i = 0; i < 3; i++) {
                for (var j = 0; j < 3; j++) {
                    var x_val = xpt[i];
                    var y_val = ypt[j];
                    x_grid.push(x_val);
                    y_grid.push(y_val);
                    z_grid.push(z0 + dz_dx_val * (x_val - xi) + dz_dy_val * (y_val - yi));
                }
            }

            var x_grid_2d = [x_grid.slice(0, 3), x_grid.slice(3, 6), x_grid.slice(6, 9)];
            var y_grid_2d = [y_grid.slice(0, 3), y_grid.slice(3, 6), y_grid.slice(6, 9)];
            var z_grid_2d = [z_grid.slice(0, 3), z_grid.slice(3, 6), z_grid.slice(6, 9)];

            var update = {
                x: [x_grid_2d],
                y: [y_grid_2d],
                z: [z_grid_2d]
            };

            var graphDiv = document.getElementById("3d-plot");
            var jsFigure = graphDiv.querySelector('.js-plotly-plot');

            Plotly.restyle(jsFigure, update , [1]);

            console.timeEnd('update_tangent_plane');
            return window.dash_clientside.no_update;
        }
        console.timeEnd('update_tangent_plane');
        return window.dash_clientside.no_update;
    }
    """,
    Output('3d-plot', 'figure'),
    Input('3d-plot', 'hoverData'),
    State('store-dz-dx', 'data'),
    State('store-dz-dy', 'data'),
    State('3d-plot', 'figure')
)
The Problem
Despite my searches and trials , the update takes about 1sec, making the interaction not fluid. Is there a more efficient way to achieve real-time updates of the tangent plane without noticeable lag?
Any suggestions or best practices would be greatly appreciated!
Thanks in advance!