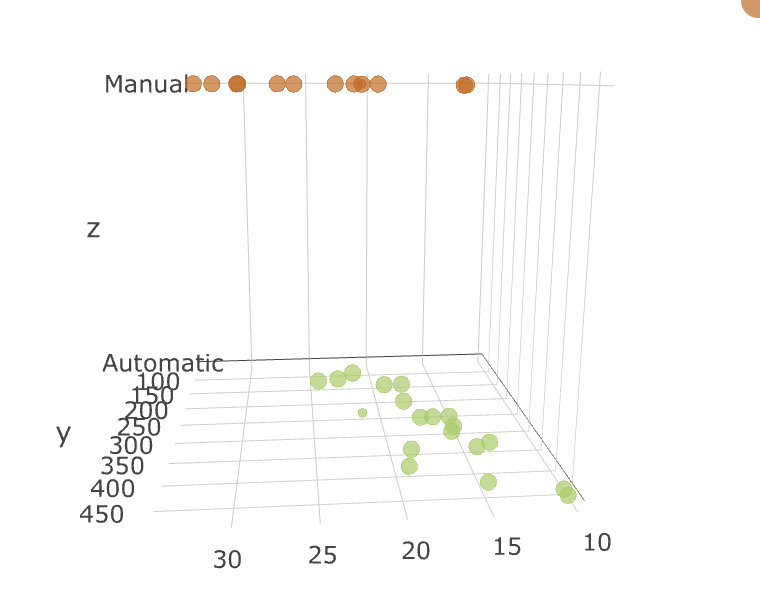
I created a 3D scatter plot in Plotly, but now I need to create a landscape out of it for viewing it better. TO demonstrate I am using dummy dataset.
mtcars$am[which(mtcars$am == 0)] <- ‘Automatic’
mtcars$am[which(mtcars$am == 1)] <- ‘Manual’
mtcars$am <- as.factor(mtcars$am)
plot= plot_ly(mtcars,x = mtcars$mpg,y = mtcars$disp,z = mtcars$am, color = ~mtcars$am, size= 1,colors = c(‘darkolivegreen3’, ‘darkorange3’))
plot
this generates a plot like this

What I am trying to achieve is to look at the height point along the scatter plot and create a landscape. Something like this

Is it possible to have a plot like above using Plotly ?