How to create multiple subplots, each with an inset plot inside it?

As per the title, I’m trying to systemically construct a subplot of scatter plots, where an inset bar plot (with different x and y axes) also resides in each subplot.

Something like this:
all_facet_insets

According to the documentation of the make_subplots function, there seems to be a way to place an inset in each subplot, but I couldn’t find an MWE in the docs, community forum, or across the web.

In my searches, I did find:

I failed in various ways to combine these resources into the desired result :slight_smile:

(This question seems also related; however, IIUC, OP wanted to place multiple insets inside a single subplot.)

Any help would be highly appreciated.

Here is an example:

from plotly.subplots import make_subplots
import plotly.graph_objects as go

fig = make_subplots(rows=2, cols=1, 
                    specs=[[{'type': 'xy'}], [{'type': 'xy'}]],
                    vertical_spacing=0.05,
                    insets=[dict(cell=(1,1), l=0.55, b= 0.43),
                            dict(cell=(2,1), l=0.5, h=0.65, b=0.1,  type='polar')])

fig.add_trace(go.Scatter(x=[0, 1, 2], y=[1.2, 0.2, 0.4], name='scatter (1,1)'), row=1,col=1)
fig.add_trace(go.Bar(x=['A', 'B', 'C'], y=[0.8, 1.15, 0.76], xaxis='x3', yaxis='y3', 
                     name='inset in (1,1)'))
fig.add_trace(go.Scatter(x=[2, 3, 4, 5], y=[1,  0.45, 1.277, 1.1], mode='markers', 
                         marker_size=15, marker_color='brown',
                         name='scatter (2,1)'), row=2, col=1)
fig.add_trace(go.Barpolar(theta=[40, 100, 155, 230, 315], r=[1, 2, 1.75, 3, 2.25], 
                          name='inset in (2,1)'))
fig.update_layout(width=650, height=600, font_size=10)


To find out the names of the axes the inset in (1,1) is referenced to, display fig.layout,
just after the definition fig=make_subplots(....). For this example the following information
is listed:

Layout({
    'polar': {'domain': {'x': [0.5, 1.0], 'y': [0.0475, 0.35624999999999996]}},
    'template': '...',
    'xaxis': {'anchor': 'y', 'domain': [0.0, 1.0]},
    'xaxis2': {'anchor': 'y2', 'domain': [0.0, 1.0]},
    'xaxis3': {'anchor': 'y3', 'domain': [0.55, 1.0]},
    'yaxis': {'anchor': 'x', 'domain': [0.525, 1.0]},
    'yaxis2': {'anchor': 'x2', 'domain': [0.0, 0.475]},
    'yaxis3': {'anchor': 'x3', 'domain': [0.72925, 1.0]}

Thanks a lot, @empet!

Since I’m interested in systemically creating such subplots with varying numbers of rows/columns, I want to place insets in their desired locations dynamically.
IIUC, assuming num_of_subplot_axes = rows * cols, the axes of the first inset are current_inset_axes = num_of_subplot_axes + 1, and the insets’ axes are in row-major ordering, left to right.
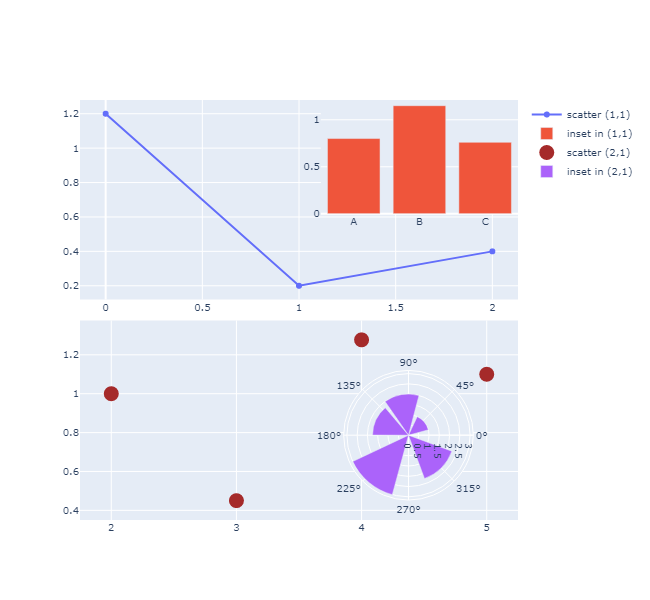
Code example
rows = 2
cols = 3
num_of_subplot_axes = rows * cols
current_inset_axes = num_of_subplot_axes + 1

fig = make_subplots(
    rows=rows,
    cols=cols,
    vertical_spacing=0.05,
    insets=[
        dict(cell=(1, 1), l=0.55, b=0.43),
        dict(cell=(1, 2), l=0.55, b=0.43),
        dict(cell=(1, 3), l=0.55, b=0.43),
        dict(cell=(2, 1), l=0.5, h=0.65, b=0.1),
        dict(cell=(2, 2), l=0.5, h=0.65, b=0.1),
    ],
)

# add subplots

fig.add_trace(
    go.Scatter(x=[0, 1, 2], y=[1.2, 0.2, 0.4], name="scatter (1,1)"), row=1, col=1
)
fig.add_trace(
    go.Scatter(x=[0, 1, 2], y=[1.2, 0.2, 0.4], name="scatter (1,2)"), row=1, col=2
)
fig.add_trace(
    go.Scatter(x=[0, 1, 2], y=[1.2, 0.2, 0.4], name="scatter (1,3)"), row=1, col=3
)
fig.add_trace(
    go.Scatter(
        x=[2, 3, 4, 5],
        y=[1, 0.45, 1.277, 1.1],
        mode="markers",
        marker_size=15,
        marker_color="brown",
        name="scatter (2,1)",
    ),
    row=2,
    col=1,
)
fig.add_trace(
    go.Scatter(
        x=[2, 3, 4, 5],
        y=[1, 0.45, 1.277, 1.1],
        mode="markers",
        marker_size=15,
        marker_color="brown",
        name="scatter (2,2)",
    ),
    row=2,
    col=2,
)

# add insets

fig.add_trace(
    go.Bar(
        x=["A", "B", "C"],
        y=[0.8, 1.15, 0.76],
        xaxis=f"x{current_inset_axes}",
        yaxis=f"y{current_inset_axes}",
        name="inset in (1,1)",
    )
)
current_inset_axes += 1
fig.add_trace(
    go.Bar(
        x=["E", "F", "G", "BLAH"],
        y=[0.8, 1.15, 0.76, 0],
        xaxis=f"x{current_inset_axes}",
        yaxis=f"y{current_inset_axes}",
        name="inset in (1,2)",
    )
)
current_inset_axes += 1
fig.add_trace(
    go.Bar(
        x=["E2", "F3", "G4", "BLAH"],
        y=[0.5, 34, 0.76, 0.67],
        xaxis=f"x{current_inset_axes}",
        yaxis=f"y{current_inset_axes}",
        name="inset in (1,3)",
    )
)
current_inset_axes += 1
fig.add_trace(
    go.Bar(
        x=["H"],
        y=[0.8],
        xaxis=f"x{current_inset_axes}",
        yaxis=f"y{current_inset_axes}",
        name="inset in (2,1)",
    )
)
current_inset_axes += 1
fig.add_trace(
    go.Bar(
        x=["I", "J"],
        y=[0.8, 1.15, 0.76],
        xaxis=f"x{current_inset_axes}",
        yaxis=f"y{current_inset_axes}",
        name="inset in (2,2)",
    )
)

fig.update_layout(width=650, height=600, font_size=10)

fig.show()

Can I rely on that?

Thanks!

Yes, you can rely on this indexing only if the basic subplots, as well as their insets, are referenced to cartesian axes. As I pointed out for the given example, when the inset is referenced to a polar system of coordinates, the cartesian axes have no meaning in this case, and you don’t have to set them.