How to combine 3 dataframes pandas into one single scatter plot graph?

Dear All,

I would like to combine 3 dataset or dataframe (pandas) into one scatter plot graph. Currently, I am only able to make an independent set of scatter plot for each dataset/dataframe by using plotly.express . Does anyone have any idea on how to combine 3 dataset or dataframe into one scatter plot graph? Thank you in advance.

Here is the code:

import plotly.express as px

df = df_final

df["Optimality"] = df["Optimality"].astype(str)
fig = px.scatter(df, x="P2", y="C2", color = "Optimality", width=800, height=800, color_discrete_sequence=["white", "blue"], category_orders={"Optimality": ["0", "1"]}, title = 'New Sequence')

fig.show()

Here is the current result for 1 dataframe:

I would like to combine other 2 dataframes into 1 scatter plot. This is the reference for the visual.

HI @Nicholas welcome to the forums.

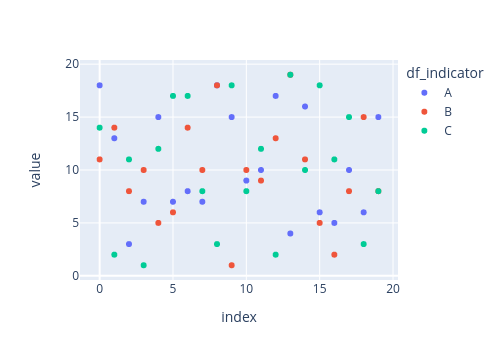
There are some ways to do that. What I would do is, adding a column to each DataFrame indicating the name/number of the DataFrame and then concatenate the single DataFrames. Afterwards I would use the color argument of px.scatter to distinguish the different data points. MRE:

import pandas as pd
import numpy as np
import plotly.express as px

def random_df(indicator, rows):
    return pd.DataFrame({'numbers': np.random.randint(1, 20, size=(rows)), 'df_indicator': [indicator] * rows})

# create single dataframes
dataframes = [random_df(name, 20) for name in 'ABC']

# concatenate single frames
df = pd.concat(dataframes)

# create figure
fig = px.scatter(df, y=['numbers'], color='df_indicator')

creates:
newplot (41)

1 Like