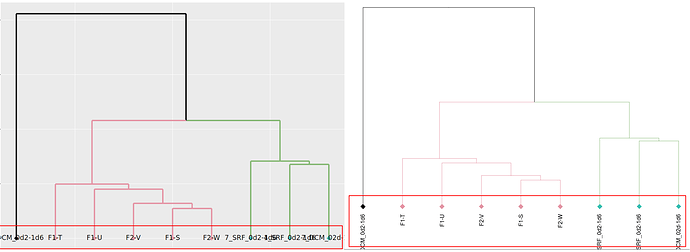
Could someone tell me how you can build dendrograms in R using plotly, as the example below in python?
Hi there,
We don’t have an R wrapper to create dendrograms at the moment, however if you’re familiar with ggplot you could try taking a look at this tutorial: https://plot.ly/ggplot2/ggdendro-dendrograms/
Very good suggestion, I used functions:
#dend2 is a object type dendogram
ggd1 <- as.ggdend(dend2)
ptest <- ggplot(ggd1, horiz = FALSE, theme = NULL)
plotly_build(ptest)
I got the result I wanted. But…
The axis captions x changed position (as shown in picture), You know how to fix this?
Does anybody know how to add these to a heatmap? I found the python code, but I wouldn’t know how to start in R
