Hi community, I wanted to format the axis ticks to have a spacing between thousands.
Eg: 100 000

Is this possible?
Hi community, I wanted to format the axis ticks to have a spacing between thousands.
Eg: 100 000
Is this possible?
@dataturnsmeon
After the stacked bar chart figure has been created, you should perform a fig update, by adding these numbers as text:
import pandas as pd
import plotly.express as px
long_df = px.data.medals_long()

fig = px.bar(long_df, x="nation", y="count", color="medal", title="Long-Form Input")
fig.show()
Inspecting the generated fig, you’ll find that it contains 3 traces:
print(len(fig.data))
the first one has the name ‘gold’, the second one, ‘silver’, and the third, ‘bronze’.
The bars in each trace are colored with the same color.
Hence defining the lists of trace names and text for each trace bar, you can update the initial figure as follows:
names = ['gold', 'silver', 'bronze']
text = [[ "215 000", "13 500", "11 000"], ["10 345", "23 000", "9 000", ], ["9 257", "7 115", "10 000"]]
for k in range(3):
    fig.update_traces(text=text[k],  selector=dict(name=names[k]))
Unfortunately the text cannot be put at the bar center, because there are only the following options for textposition:
['inside', 'outside', 'auto', 'none']
Here the textposition is set by px.bar, as 'auto'. You can update it through:
for k in range(3):
    fig.update_traces(text=text[k],  textposition = 'inside', selector=dict(name=names[k]))
but the text is located in the same position as with 'auto'.
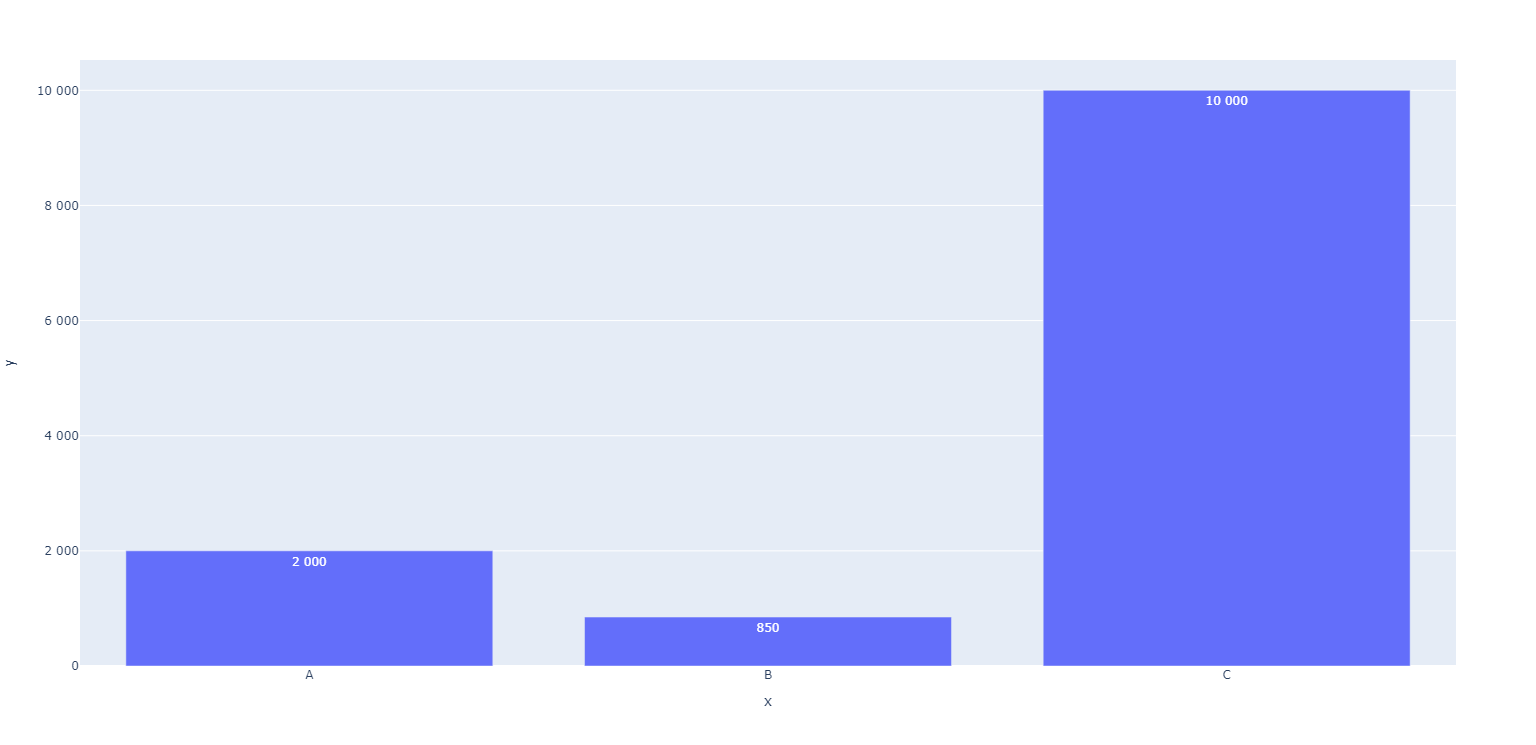
Adding a space character at thousands separator on the axis is very easy with the use of separators attribute in update_layout. However to apply the same formatting on the bar text values we need to transform the values. See below example code:
import plotly.express as px
x=['A','B','C']
y=[2000, 850, 10000]
formatted_y = [f"{x:,}".replace(",", " ").split(".")[0] for x in y] # for showing values with a thousands space on bar

fig = px.bar(x=x, y=y, text=formatted_y)

fig.update_yaxes(tickformat=",")
fig.update_layout(separators="* .*") # this line sets the format for separators
fig.show()
Awesome !
Thank you @empet and @atharvakatre