I have a scatter3d plot of geospatial data where I would like to add a north arrow. This arrow would ideally be located off the axis and remain pointing North during user rotations. I have not had luck with annotated arrows. 3d cone traces come close but an arrow visible during all rotations would be nice. Thanks.
Hi @mjs
Welcome to Plotly forum!!
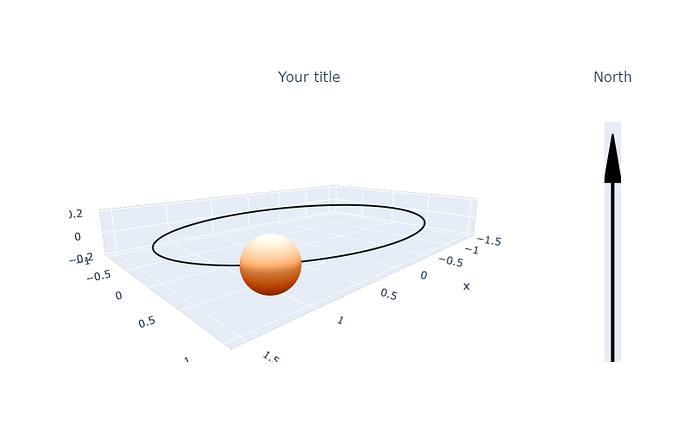
Since you did not give sufficient details on your orbital motion I plotted a sphere as orbitting celestial body, and a vertical arrow to point out the North.
From this example you can deduce how to transform the code to get your desired traces.
The basic idea is to define 2 subplots placed in a row and two columns. In the cell (1,1), referenced to a 3d system of coordinates, is plotted the sphere and its orbit, while in the cell (1,2,) the vertical arrow and its support, referenced to a 2d system of coordinates.
After giving the subplot definition:
fig = make_subplots(
    rows=1, cols=2, subplot_titles=('Your title', 'North'),
    specs=[[{"type": "scene"}, {"type": "xy"}]],# this line contains info on the reference system in each cell
    horizontal_spacing=0.01
)
we are inspecting the figure layout to read off the x-domain for each subplot cell, to be able to modify it in concordance with our desired settings, i.e. a wider window for the 3d plot and and a thinner one for the arrow:
fig.layout

Layout({
    'annotations': [{'font': {'size': 16},
                     'showarrow': False,
                     'text': 'Your title',
                     'x': 0.2475,
                     'xanchor': 'center',
                     'xref': 'paper',
                     'y': 1.0,
                     'yanchor': 'bottom',
                     'yref': 'paper'},
                    {'font': {'size': 16},
                     'showarrow': False,
                     'text': 'North',
                     'x': 0.7525,
                     'xanchor': 'center',
                     'xref': 'paper',
                     'y': 1.0,
                     'yanchor': 'bottom',
                     'yref': 'paper'}],
    'scene': {'domain': {'x': [0.0, 0.495], 'y': [0.0, 1.0]}},
    'template': '...',
    'xaxis': {'anchor': 'y', 'domain': [0.505, 1.0]},
    'yaxis': {'anchor': 'x', 'domain': [0.0, 1.0]}
})
This the code:
from plotly.subplots import make_subplots
import plotly.graph_objects as go
import numpy as np
from numpy import sin, cos, pi

fig = make_subplots(
    rows=1, cols=2, subplot_titles=('Your title', 'North'),
    specs=[[{"type": "scene"}, {"type": "xy"}]],
    horizontal_spacing=0.01
)

#left right, respectively left1, right1 gives the x-domains for each subplot cell
left = 0
right = 0.87
left1 = right + 0.1
right1 = 1

#change the x-domains from equal to inequal  lengths
fig.layout.scene.domain.update(x=[0, right])
fig.update_scenes(aspectmode='data', camera_eye=dict(x=1.65, y=1.65, z=0.5))
fig.update_xaxes( domain=[left1, right1], visible=False)
fig.update_yaxes(domain=[0, right], range=[0, 1], visible=False);
fig.layout.annotations[0].update(x=(left+right)/2) # Move the default position of titles
fig.layout.annotations[1].update(x=(left1+right1)/2); # to the centers of the new subplot windows
fig.update_layout(width=800, height=500)


#define the elliptcial orbit
t = np.linspace(0, 2*pi, 100)
a = 1.5
b = 1
x = a*cos(t)
y = b*sin(t)
z = np.zeros(x.shape)

fig.add_trace(go.Scatter3d(x=x, y=y, z=z,
                           mode='lines',
                           line_width=4, line_color='rgb(20,20,20)',
                           showlegend=False), row=1, col=1);
#end orbit definition

#define the orbitting sphere (elestial body)
v = np.linspace(-pi/2, pi/2, 50)
u, v = np.meshgrid(t, v)
r = 0.2
s  = pi/4
X  = a*cos(s) + r*cos(u)*cos(v)
Y  = b*sin(s) + r*sin(u)*cos(v)
Z  =  r*sin(v)

fig.add_trace(go.Surface(x=X, y=Y, z=Z, colorscale='oranges_r', showscale=False,
                         #, colorbar_x=left-0.15, colorbar_thickness=20
                        ), row=1, col=1);
#end sphere definition

#Define the arrow from the point A to point B, of width width
#the arrow has a vertical support line

widh = 0.0125  #2*widh is the width of the arrow base as triangle
startA = 0.75
endA = 0.95
A = np.array([0, startA])
B = np.array([0, endA])
v = B-A
w = v/np.linalg.norm(v)# unit vector
u  =np.array([-v[1], v[0]])  #u orthogonal on  w

P = B - (endA - startA)*w
S = P - widh*u
T = P + widh*u

fig.add_trace(go.Scatter(x = [S[0], T[0], B[0], S[0]], # arrow defined as filled triangle
                         y = [S[1], T[1], B[1], S[1]],
                         mode='lines',
                         fill='toself',
                         fillcolor='black',
                         line_color='black',
                         showlegend=False,
                         hoverinfo='none',), row=1, col=2)
fig.add_trace(go.Scatter(x = [0, 0], # the arrow support as a scatter line
                         y = [0, endA-0.1], #for a shorter line take y=[0.2, endA-0.1]
                         mode='lines',
                         showlegend=False,
                         line_width=4,
                         hoverinfo='none',
                         line_color='black'), row=1, col=2);
and this is the corresponding figure:
The arrow length can be shortened, as it is mentioned in a line comment, above.
Thank you for your reply. However, that’s not exactly what I was looking for. The north arrow does not track with user orbital rotation to always point to north. Here is what I have so far. The cone trace points north and always does during rotation, however, I feel like this is a hack and would prefer something like this in the corner, off the axes.
import plotly
import plotly.graph_objs as go


lon = [-119.090954, -119.0429801, -119.0466354, -119.0986616, -119.0601237]
lat = [35.38214087, 35.44760513, 35.34938881, 35.37179955, 35.36318077]
elev = [-1264.92, -1001.36, -1691.64, -1249.68, -1478.28]

trace1 = go.Scatter3d(x=lon,
                      y=lat,
                      z=elev,
                      mode='markers',
                      marker=dict(size=12, color='red'))


trace_north = go.Cone(x=[-119.035], y=[35.462], z=[300],
                      u=[0], v=[1], w=[1],
                     sizemode='scaled',
                     sizeref=0.015,
                     showscale=False,
                     colorscale='Blackbody')


camera = dict(up=dict(x=0, y=0, z=1),
              center=dict(x=0, y=0, z=0),
              eye=dict(x=-.75, y=-1.35, z=0.85))

layout = go.Layout(scene=dict(xaxis=dict(title='Longitude'),
                              yaxis=dict(title='Latitude'),
                              zaxis=dict(title='Elevation'),
                              camera=camera))

data = [trace1, trace_north]

fig = go.Figure(data=data, layout=layout)

plotly.offline.plot(fig, filename='north-arrow-test.html')
From your initial requirement, “This arrow would ideally be located off the axis and remain pointing North during user rotations”, how could I have deduced that you want a system of orthogonal axes with arrows pointing their direction?
The system of axes in the image at the posted link is typical for OpenGL. Plotly references the plots to a physical system of axes, with +z axis pointing North, not +y.
For each axis you have to define a go.Scatter3d.line
for Ox: x=[0, xmax], y =[0,0], z=[0,0]
Oy: x =[0,0], y=[0,ymax], z=[0,0]
Oz: x=[0,0], y=[0,0], z=[0, zmax]
where xmax, ymax, zmax are the max values of your x, y, z-data in the scatter3d plot.
At the end of each axis you should define the cones that point the axis +direction.
For each cone you’ll specify its position and direction:
The cone definition for xaxis arrow:
go.Cone(x=[xmax], y=[0], z=[0], u=[1], v=[0], w=[0])
and similarly for the arrows associated to yaxis, and zaxis.
