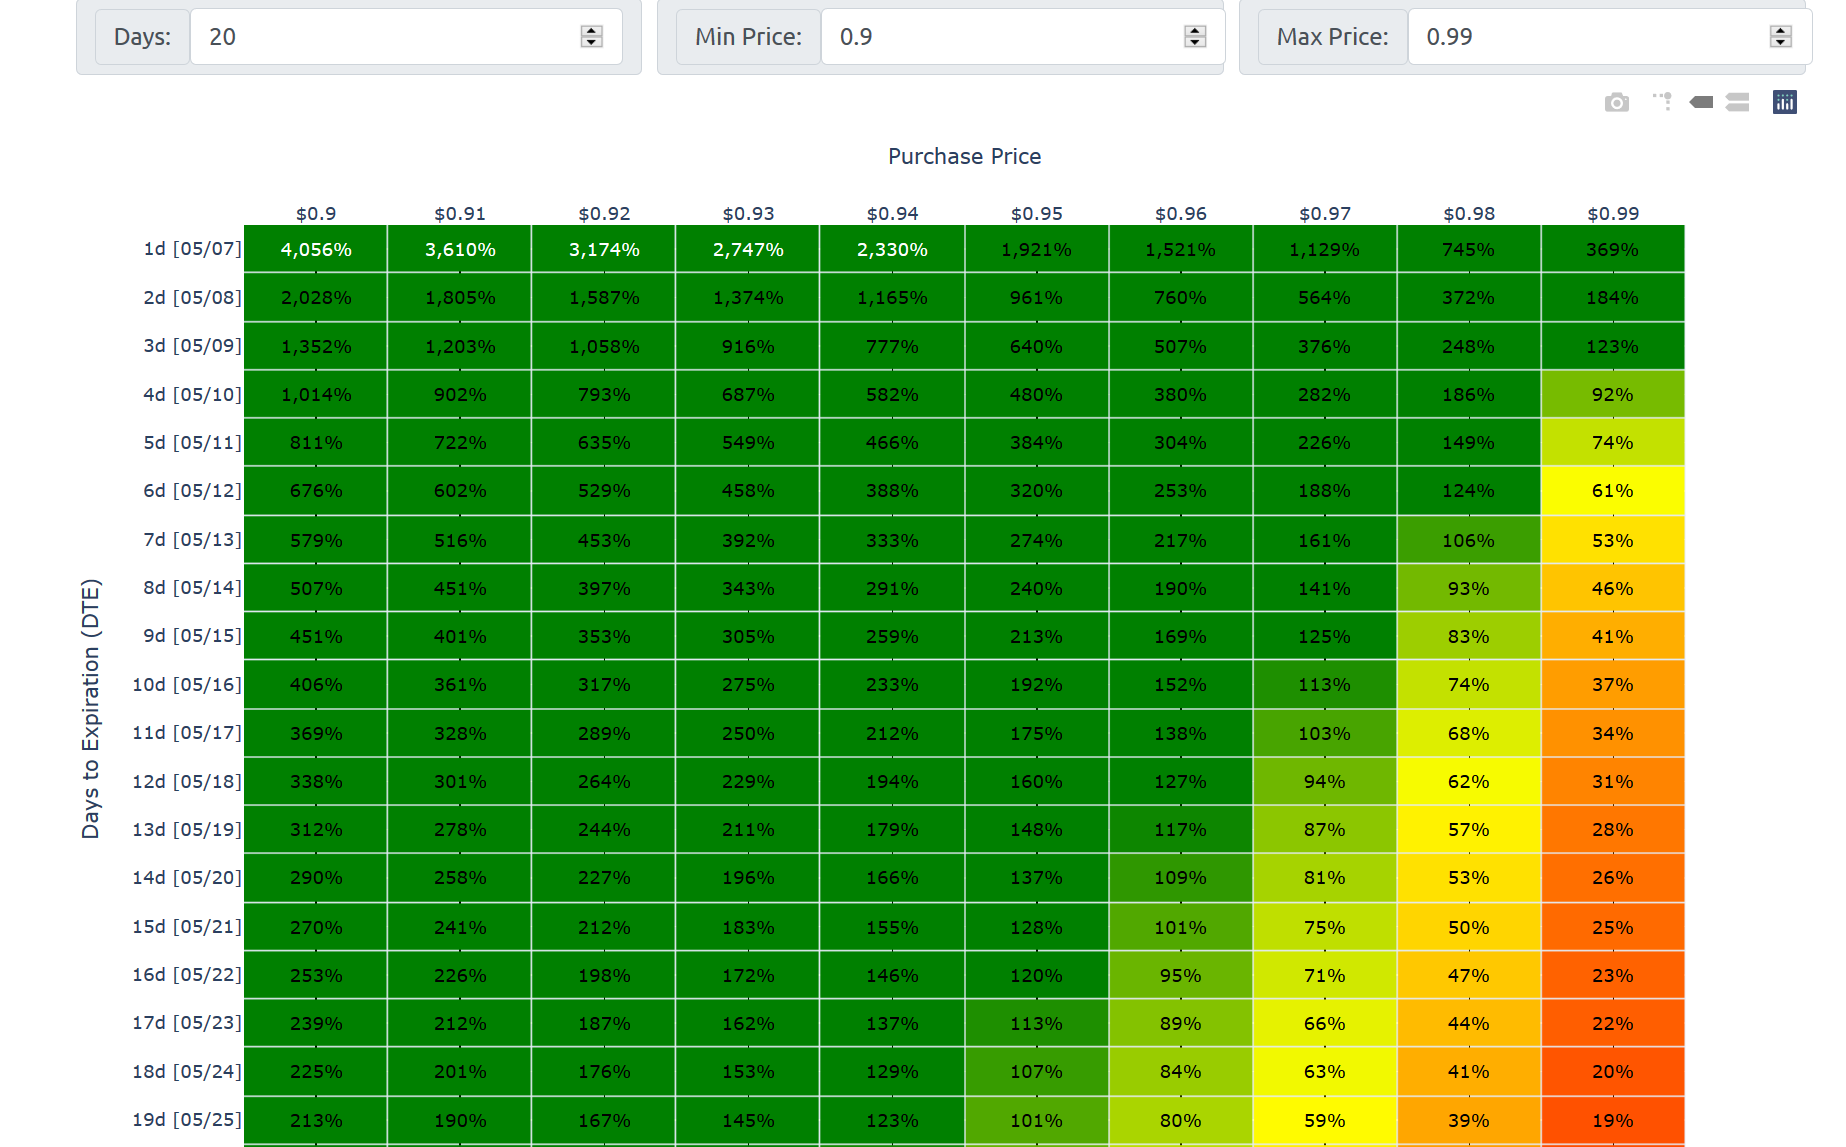
I created the following heatmap:
I want the font color of the green cells to be white, and the red+yellow cells to be black. I’m not sure why it’s making the first five or so cells white, and I couldn’t find anything in the documentation about how font_colors is supposed to work.
My code:
        z=z,
        annotation_text=z_labels,
        # colorscale='rdylgn',
        colorscale=['red', 'yellow', 'green'],
        font_colors=['black', 'black', 'white'],
        zmid=60,
        zmin=0,
        zmax=120,
        x=price_levels,
        y=days,
        xgap=1,
        ygap=1,
    )

    fig['layout']['yaxis']['autorange'] = "reversed"
    fig['layout']['yaxis']['fixedrange'] = True
    fig['layout']['yaxis'].update(side="left")

    fig['layout']['xaxis']['fixedrange'] = True
    fig['layout']['xaxis'].update(side="top")
    fig.update_yaxes(nticks=n_days, ticktext=y_labels, tickvals=days, title_text='Days to Expiration (DTE)')
    fig.update_xaxes(nticks=len(price_levels), ticktext=x_labels, tickvals=price_levels, title_text='Purchase Price')```
1 Like
Hi @BigSteak4 the docstring of create_annotated_heatmap explains how the font_colors argument works:
" font_colors ( ( list ) ) – List of two color strings: [min_text_color, max_text_color] where min_text_color is applied to annotations for heatmap values < (max_value - min_value)/2. If font_colors is not defined, the colors are defined logically as black or white depending on the heatmap’s colorscale."
So you can only have two values, one of them is used to color the z values smaller than the middle of the z range and the other color is used for the values larger than the middle value.
If you need to change the colors you will have to loop through the annotations (if you do a print(fig) you’ll see that the text is made of layout annotations) to change the colors.
1 Like
I see. Can I make a suggestion to use the zmid value to determine which font_colors shall be applied?
In my example, I want everything below 60 to be increasingly red and everything above 60 to be increasingly green. I need to specify the midpoint because if I don’t, values way above 60 can appear red even though they should be green.
I got the cell fill colors working the way I want by setting the zmid, zmax, and zmin values manually, but even if I only have two values for font_colors, it still uses the midpoint calculated in the way you described. This results in the text being hard to read.
Other, more complicated suggestions would allow passing in a dictionary to determine the values, or allowing a colorscale for font_colors so the text can fade to black/white or whatever works for the colorscale you describe. But even just using the zmid value would fix the issue I’m having. I can probably do this using the layout_annotations link you provided, but I still think a better way to determine the midpoint would be to use zmid if it was set manually.
2 Likes