Hi,
I am working on some Multiple Trace Violin Plots, using this data model: https://plot.ly/javascript/violin/#multiple-traces-violin-plot.
For particular “traces” with an empty no data points, plotly js doesn’t seem to plot anything at all. I was wondering if there’s any way to plot an empty violin plot.
I am using plotly.js with vue, but a simplified version of my code:
There is no data for “target: 3”, but I would like plotly js to still plot an empty chart.
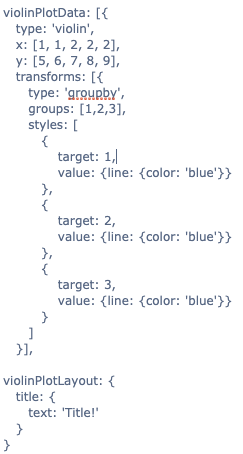
Printed code:
violinPlotData: [{
type: ‘violin’,
x: [1, 1, 2, 2, 2],
y: [5, 6, 7, 8, 9],
transforms: [{
type: ‘groupby’,
groups: [1,2,3],
styles: [
{
target: 1,
value: {line: {color: ‘blue’}}
},
{
target: 2,
value: {line: {color: ‘blue’}}
},
{
target: 3,
value: {line: {color: ‘blue’}}
}
]
}],
violinPlotLayout: {
title: {
text: ‘Title!’
}
}