title, how can i make this bar chart a continuous bar
thank you
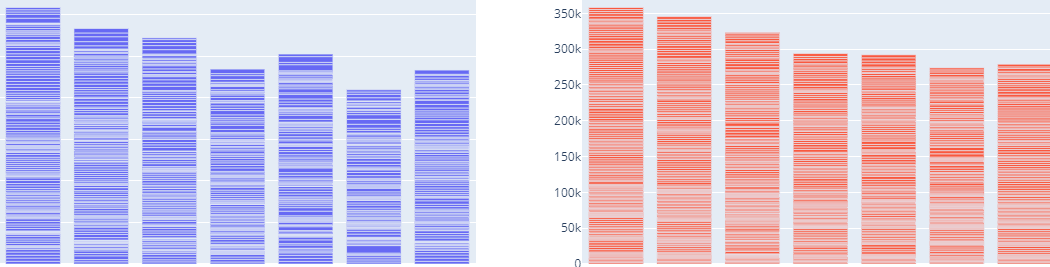
Hi @Hughugy! Could you provide the code you used to create this visualization? I suspect I know what’s going on but without the code it’s hard to say definitively.
fig = make_subplots(cols = 2)

fig.add_trace(go.Bar(x = data['a'], y =data['b'], row =1, col=1)

fig.add_trace(go.Bar(x =data['a'], y = data['c'], row =1, col =2)
fig.show()
nevermind, i found the solution by make a new pandas frame from my dataset
thx 