I am at a loss and a little brain dead at this point.
I can produce the data. I can produce the chained callbacks that compel the user to choose gender and age ranges - the two of the three filters I want to apply to the data, producing different outputs depending on those choices.
Instead of these outputs, however, I need to produce bar charts, based on the user’s parameters.
But I am not able to figure out how to translate the parameters supplied by the user into bar charts. The code is below. A snippet of the unfiltered data is also pasted below. What am I missing? How do I use chained callbacks to filter a dataframe and produce bar charts based the parameters supplied by the user?
I’ve been trying to figure it out piecing together sample code and video tutorials for hours.
Here is the code:
all_options = {
    'Males': ['< 14', '14-18', '19-30', '31-50', '51+'],
    'Females': [u'< 14', '14-18', '19-30', '31-50', '51+']
}
app.layout = html.Div([
    dcc.RadioItems(
        id='genders-radio',
        options=[{'label': k, 'value': k} for k in all_options.keys()],
        value='Males'
    ),

    html.Hr(),

    dcc.RadioItems(id='ages-radio'),

    html.Hr(),

    html.Div(id='display-selected-values')
])


@app.callback(
    Output('ages-radio', 'options'),
    Input('genders-radio', 'value'))
def set_cities_options(selected_country):
    return [{'label': i, 'value': i} for i in all_options[selected_country]]


@app.callback(
    Output('ages-radio', 'value'),
    Input('ages-radio', 'options'))
def set_ages_value(available_options):
    return available_options[0]['value']


@app.callback(
    Output('display-selected-values', 'figure'),
    Input('genders-radio', 'value'),
    Input('ages-radio', 'value'))

def display_graph(selected_genders, selected_ages):

    **# Produce charts dependent on user inputs ultimately allowing the user to tailor the**
**    # report based on gender, age group and specified list of nutrients.**

    return fig
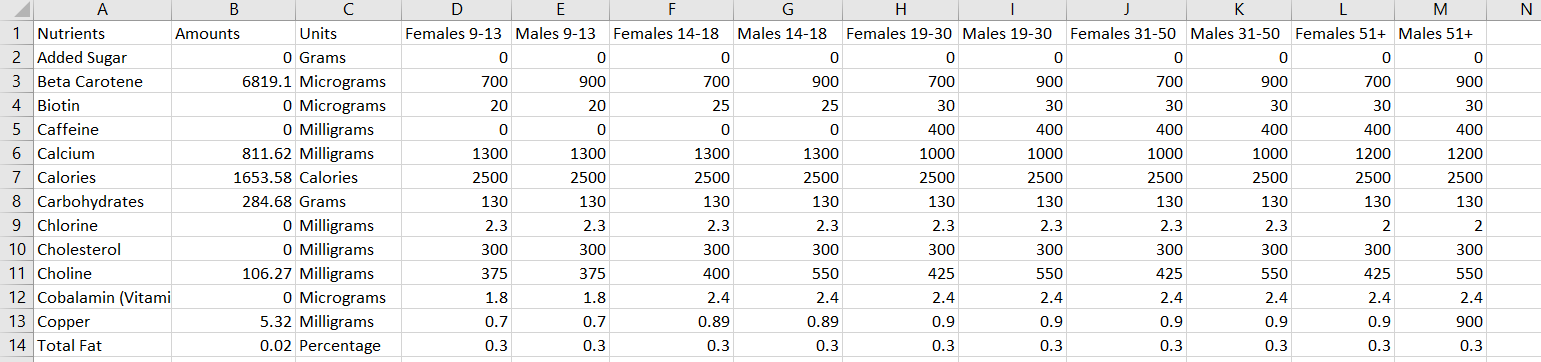
Here is a sample of input data:
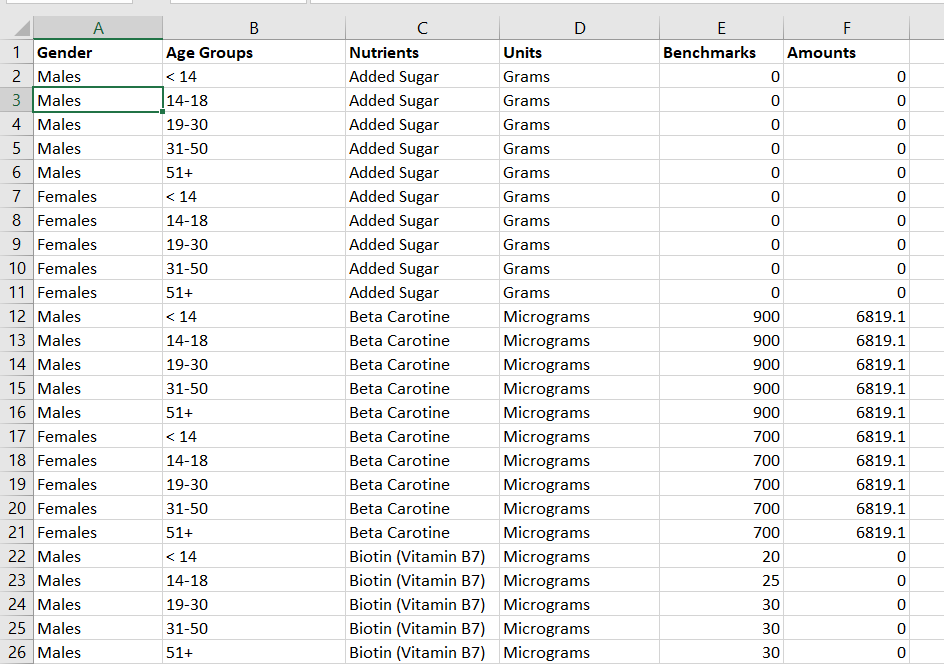
I can also work with the data in this format, which should simplify the filtering process to a single drop down.