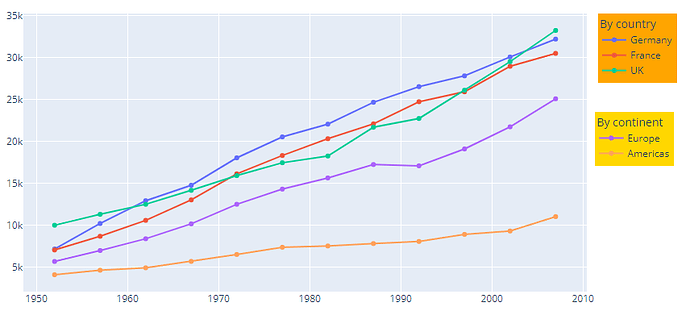
Hi, I just tried the code snippet from the example in the latest version of Plotly (5.18), Python 3.12
But only a single legend is appearing:
The code I tried is copy-pasted from the example:
import plotly.graph_objects as go
from plotly import data

df = data.gapminder()

df_germany = df.loc[(df.country.isin(["Germany"]))]
df_france = df.loc[(df.country.isin(["France"]))]
df_uk = df.loc[(df.country.isin(["United Kingdom"]))]


df_averages_europe = (
    df.loc[(df.continent.isin(["Europe"]))].groupby(by="year").mean(numeric_only=True)
)
df_averages_americas = (
    df.loc[(df.continent.isin(["Americas"]))].groupby(by="year").mean(numeric_only=True)
)


fig = go.Figure(
    data=[
        go.Scatter(x=df_germany.year, y=df_germany.gdpPercap, name="Germany"),
        go.Scatter(x=df_france.year, y=df_france.gdpPercap, name="France"),
        go.Scatter(x=df_uk.year, y=df_uk.gdpPercap, name="UK"),
        go.Scatter(
            x=df_averages_europe.index,
            y=df_averages_europe.gdpPercap,
            name="Europe",
            legend="legend2",
        ),
        go.Scatter(
            x=df_averages_americas.index,
            y=df_averages_americas.gdpPercap,
            name="Americas",
            legend="legend2",
        ),
    ],
    layout=dict(
        title="GDP Per Capita",
        legend={
            "title": "By country",
            "xref": "container",
            "yref": "container",
            "y": 0.65,
            "bgcolor": "Orange",
        },
        legend2={
            "title": "By continent",
            "xref": "container",
            "yref": "container",
            "y": 0.85,
            "bgcolor": "Gold",

        },
    ),
)

fig.show()
Best regards,
Juanmi
EDIT: Actually when saving the figure it works (svg, png, html), so it seems to be buggy only in Jupyter notebooks environments


