Hi @kristada619,
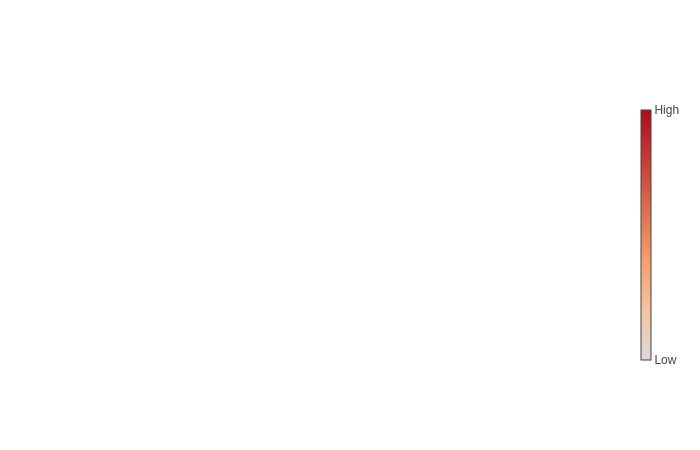
Here’s an example of creating a dummy colorbar trace with the colorbar labeled “High” and “Low”.
import plotly.graph_objs as go
from plotly.offline import init_notebook_mode, iplot
init_notebook_mode()

colorbar_trace=go.Scatter(x=[None],
             y=[None],
             mode='markers',
             marker=dict(
                 colorscale='Reds',
                 showscale=True,
                 cmin=-5,
                 cmax=5,
                 colorbar=dict(thickness=10, tickvals=[-5, 5], ticktext=['Low', 'High']),
             ),
             hoverinfo='none'
            )

layout = dict(xaxis=dict(visible=False), yaxis=dict(visible=False))
fig = go.Figure([colorbar_trace], layout)
iplot(fig)
To add this to an existing figure, you could use the add_trace figure method.
fig.add_trace(colorbar_trace)
Hope that helps!
-Jon