Hey all, I have a requirement in which I have to toggle a trace by clicking on a button and show some info about that trace in a popup or any where text. so for this I came to an idea of using annotation with buttons. But i think it doesn’t look good because it creating problem hen graph resized or other problem also. Any other ideas to do this.
Function to Show graph
def line_graph(df, xs, ys):
fig = px.line(df, x=xs, y=ys, render_mode='svg', labels={'value': "Bpm"})
fig.update_layout(
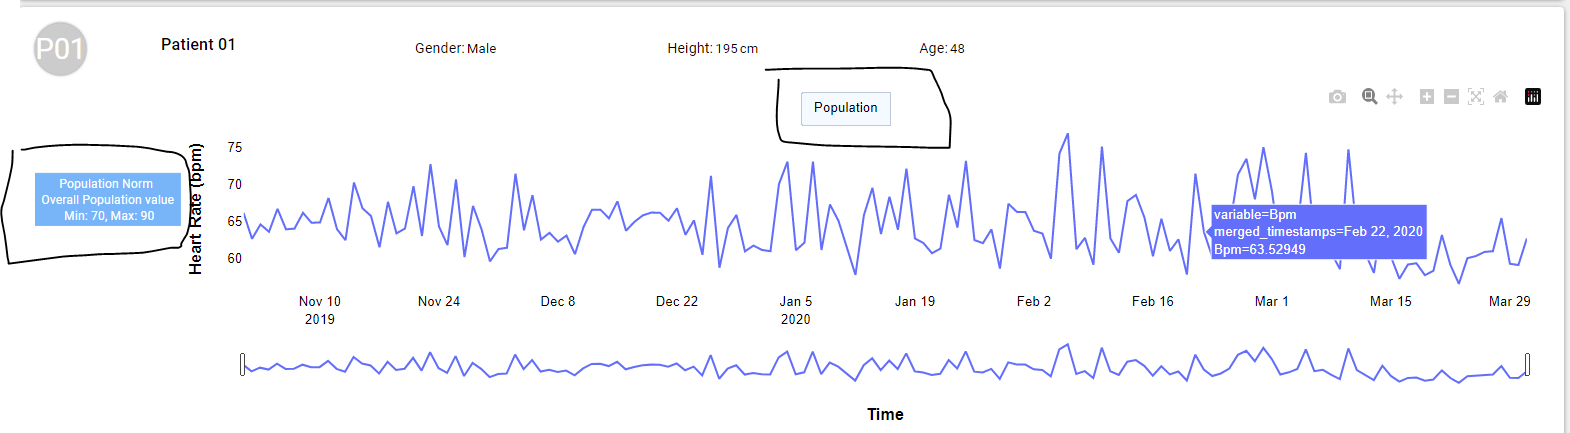
xaxis_title='<b>Time</b>',
yaxis_title='<b>Heart Rate (bpm)</b>',
showlegend=False,
font_color='rgb(150, 150, 150)',
font_size=10,
autosize=True,
plot_bgcolor='white',
margin=dict(
autoexpand=True,
l=80,
r=20,
t=20,
b=50
),
font=dict(
family="Arial",
size=13,
color="Black"
)
)
low_annotations = [
dict(
x=xs, y=0.8,
xref="paper", yref="paper",
text="Population Norm <br> Overall Population value <br> Min: 70, Max: 90",
ax=0, ay=40,
font=dict(
family="Roboto, monospace",
size=12,
color="#ffffff"
),
bordercolor="#78b5f8",
borderwidth=1,
borderpad=2,
bgcolor="#78b5f8",
opacity=1
)]
hide_trace = ys[1:]
fig.for_each_trace(lambda trace: trace.update(visible="legendonly") if trace.name in hide_trace else ())
fig.update_layout(
updatemenus=[
dict(
type="buttons",
direction="right",
active=-1,
x=0.57,
y=1.2,
bgcolor="#adccef",
xanchor="right",
yanchor="top",
pad=dict(
l=20,
r=30
),
buttons=list([
dict(
label="Population",
method="update",
args=[{'visible': [True]}, {"annotations": low_annotations}, [1, 2]],
args2=[{'visible': [False]}, {"annotations": []}, [1, 2]]
),
]),
)
])
newnames = {'beat_per_minute': 'Bpm', 'pop_min': 'Population Min', 'pop_max': 'Population Max',
'profile_min': 'Profile Min', 'profile_max': 'Profile Max', 'merged_timestamps': 'Day Time',
'static_min': 'Static Min', 'static_max': 'Static Max', 'day_dynamic_min': 'Day dynamic min',
'day_dynamic_max': 'Day dynamic Max', 'night_dynamic_min': 'Dynamic Night min',
'night_dynamic_max': 'Dynamic Night Max'}
fig.for_each_trace(lambda t: t.update(name=newnames[t.name],
legendgrouptitle_text="Second Group Title",
legendgroup=newnames[t.name],
hovertemplate=t.hovertemplate.replace(t.name, newnames[t.name])))
fig.update_xaxes(
rangeslider_visible=True,
)
fig.update_layout(
xaxis_domain=[0.09, 1.0]
)
return fig
And 2nd problem i have got is if i use ‘relayout’ method in buttons it work on trace but not on annotation because it need “relayout” so i try “update” but it only works for annotation not hiding or showing trace. what on this.
I am working in plotly dash. so any way we can get these buttons click event in callback it will also helpful.
Need any other information or you dot understand please ask.