Hi,
First off, really enjoying working with Plotly, I’ve run into a bit of a roadblock though and I can’t find the answer in the API…
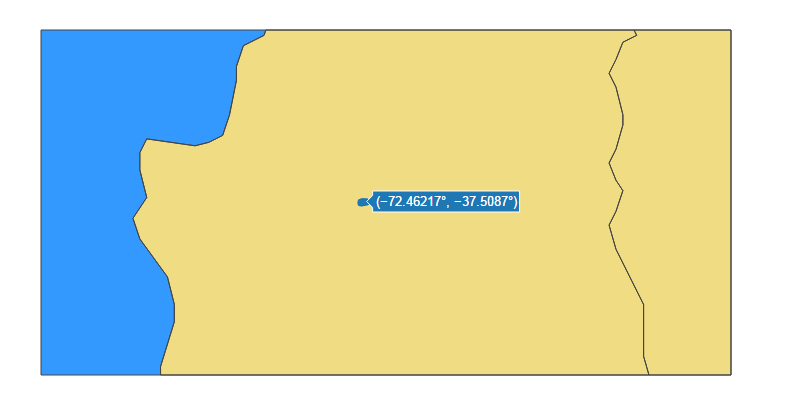
Is there any way to significantly increase the scale that a Scattergeo figure can be zoomed into please? I have a map in a Jupyter notebook, and I’ve plotted points on it, but my points are only approx… 100 m apart, and I can’t seem to zoom in enough to distinguish between them.
I’ve tried increasing the “resolution” attribute of the “layout” dict but haven’t noticed any difference in zooming capability.
Is it possible to increase the zooming limits of a Plotly figure please?
Many thanks in advance!
trace = dict(
type=‘scattergeo’,
lon = df[‘Longitude’],
lat = df[‘Latitude’],
mode=‘markers’)
lyt = dict(geo = dict(lonaxis=dict(showgrid=True), showland=True, showocean=True, showcountries=True, projection = dict(scale=1)))
map = go.Figure(data = [trace], layout = lyt)
py.iplot(map)
https://plot.ly/python/reference/#layout-geo-resolution should be exactly what you’re looking for.
Warning. I don’t recommend bumping up the resolution on interactive full-globe maps. Though, bumping up the resolution on image exports is a great idea.
Hi Etienne,
Thanks a million for the link, much appreciated! Unfortunately the resolution seems to only allow two values, 50 and 110. Even at a resolution of 50 I can’t distinguish between the points on my plot, as they are approximately 100 m apart, and a resolution of 50 means that 1 mm corresponds to 50 km. Is 50 the highest resolution that a Plotly map can have, or is there a way to increase this please? I’ve tried other values and it seems that unless the value is 50, the map defaults to 110.
Duly noted about increasing the resolution on interactive maps, thanks for the tip!
trace = dict(
type=‘scattergeo’,
lon = df[‘Longitude’],
lat = df[‘Latitude’],
mode=‘markers’)
lyt = dict(geo = dict(resolution=50, lonaxis=dict(showgrid=True), showland=True, showocean=True, showcountries=True, projection = dict(scale=1)))
map = go.Figure(data = [trace], layout = lyt)
py.iplot(map)