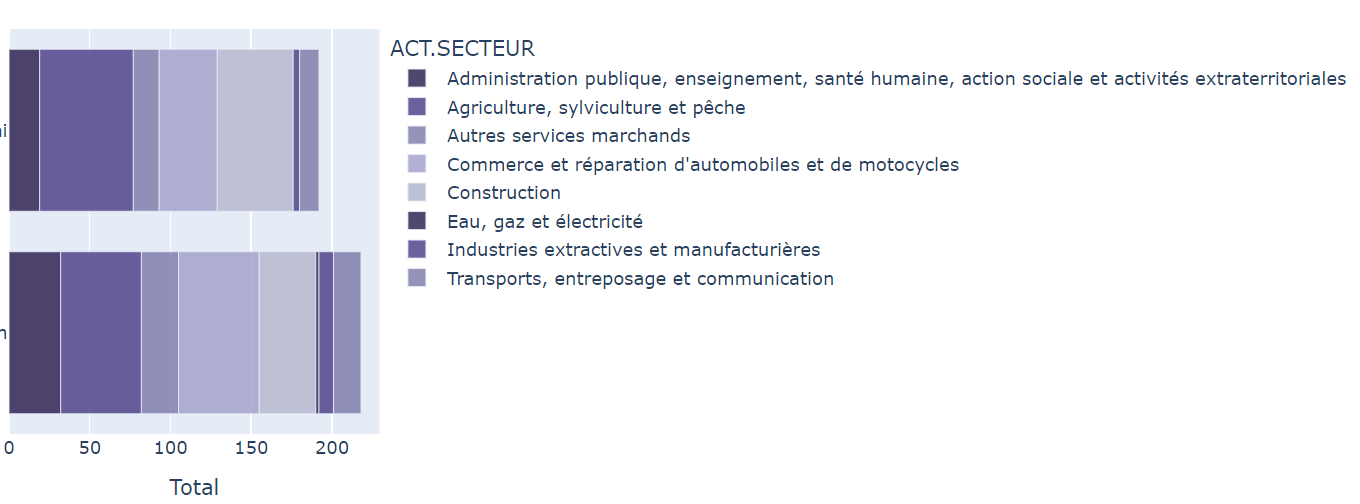
Scrollbox is greater than the plot !
how can I resize the plot or change the place of My scrollbox ?
Scrollbox is greater than the plot !
how can I resize the plot or change the place of My scrollbox ?
hi @sanae
It might be helpful to rename the values before you plot them, so they are not so long.
You can also try to reposition the legend on the page. For example:
import plotly.express as px
df = px.data.gapminder().query("continent == 'Oceania'")
fig = px.line(df, x='year', y='lifeExp', color='country', markers=True)
fig.update_layout(legend_xanchor='right', legend_yanchor='middle', legend_x=0.5)
fig.show()
You can find more info on legend parameters here.
Hey @adamschroeder thank you for reply
I think the second solution will be great but it shows like this ! , the plot is under the scrollbox
This is my code :
fig.update_layout(legend_xanchor='auto', legend_yanchor='auto', legend_x=1.5)
Did did blur the text or was it a bug in the code?
No isn’t a bug , but The plot is under scrollbox I cant see it
