Hi, I am trying to create a bar chart that shows how money was received by households according to their income. For that I am using the following code:
chart <- plot_ly(funds,
                  x = ~income_group,
                  y = ~FundsSent,
                  type = "bar")

chart <- chart %>% layout(title = '<b>Fund Distribution by Income</b>',
                            xaxis = list(
                              title = list(text='Income', standoff = 10),
                              ticks="outside", tickson="boundaries"),
                            yaxis = list(
                              title = list(text='Funds paid', standoff = 10)),
                            bargap = 0.05)
Now, with "tickson=boundaries" I managed to get the tickmarks at the end of every bar (rather than centered), but the labels are still in the middle of the column.
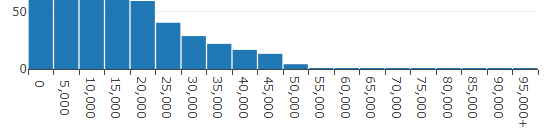
This tells the wrong story, as it would appear that the first column for example shows the funds paid to those with 0 income, when instead it’s showing the funds paid to those with income 0 to 5,000.
I have also tried setting the X axis labels by hand, using tickmode="array" , ticktext and setting tickvals manually but, while that aligns the ticks with the text, it goes again to centering the tickmarks (as if the tickson="boundaries" argument wasn’t working anymore). Lastly, I tried using offset=0.5 or offset=2500 and that didn’t work either.
Any help for a desperate and frustrated economist?