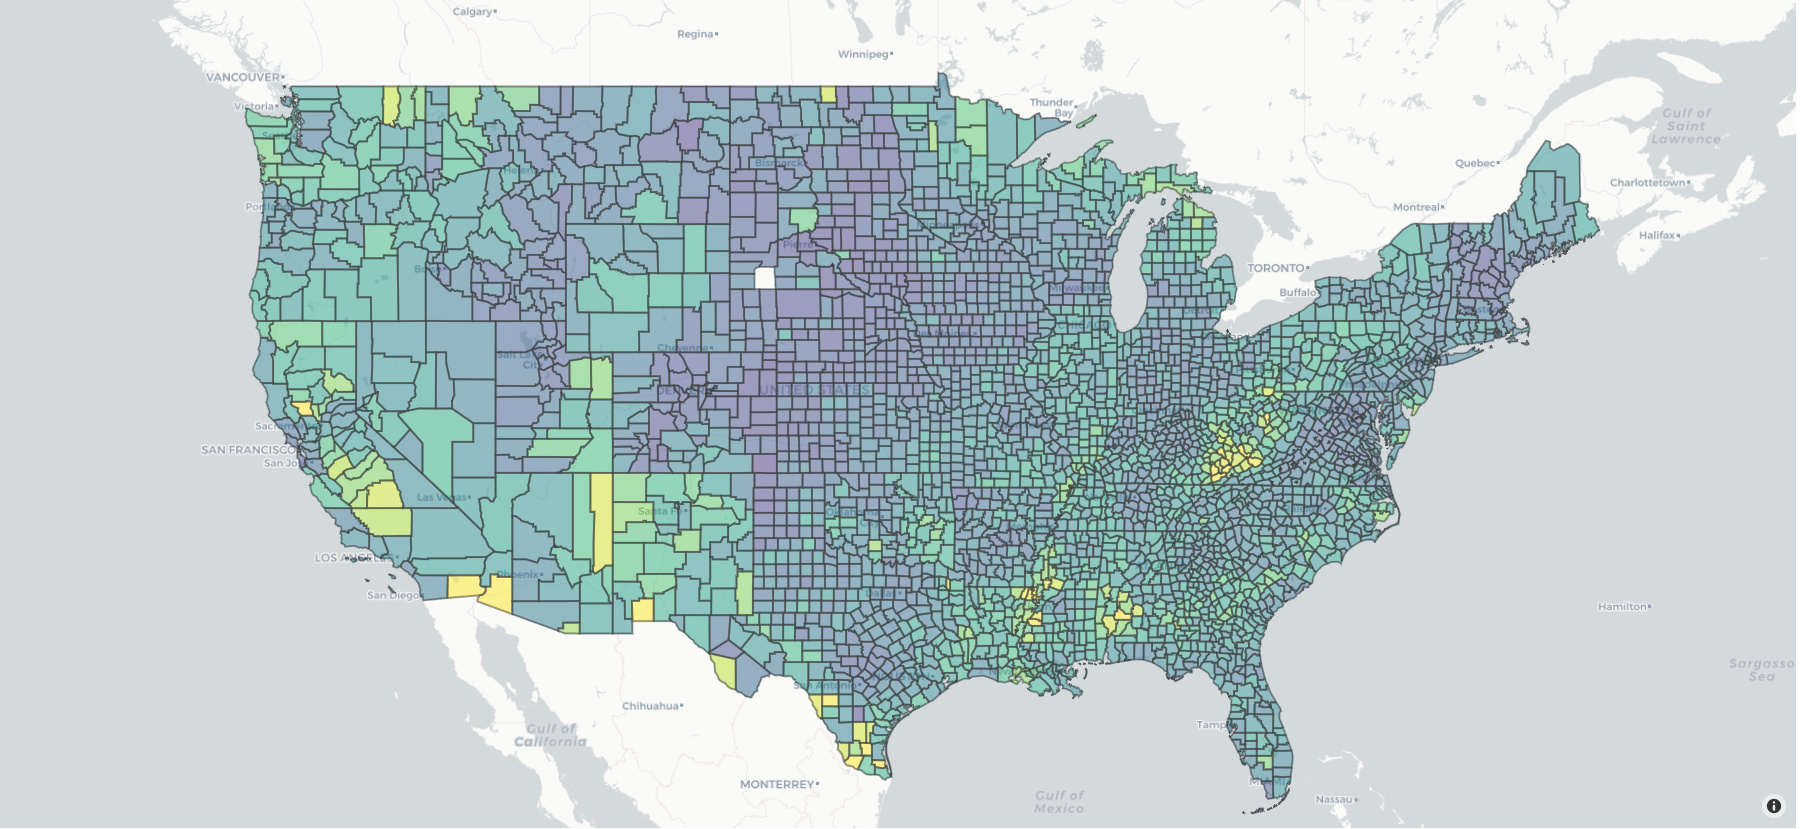
I use this code to display map. I want to ask:
- How can I change border to inner area.
- Different color for different area (for example: yellow border for yellow area and dark green border for green area).
import json
from urllib.request import urlopen
with urlopen('https://raw.githubusercontent.com/plotly/datasets/master/geojson-counties-fips.json') as response:
    counties = json.load(response)

import pandas as pd
df = pd.read_csv("https://raw.githubusercontent.com/plotly/datasets/master/fips-unemp-16.csv",
                   dtype={"fips": str})

import plotly.graph_objects as go

fig = go.Figure(go.Choroplethmapbox(geojson=counties, locations=df.fips, z=df.unemp,
                                    colorscale="Viridis", zmin=0, zmax=12,
                                    marker_opacity=0.5, marker_line_width=2))
fig.update_layout(mapbox_style="carto-positron",
                  mapbox_zoom=3, mapbox_center = {"lat": 37.0902, "lon": -95.7129})
fig.update_layout(margin={"r":0,"t":0,"l":0,"b":0})
fig.show()