
i want to add vertical line on my graph wherever i click on the graph. Just like this:
Hey @ds2636037
If you do not insist on toggle button, you can alternatively add a switch button.
The alternative implementation would be:
from dash import Dash, html, dcc, Input, Output
import pandas as pd
import plotly.express as px
import dash_mantine_components as dmc


# Incorporate data
file = 'https://raw.githubusercontent.com/plotly/datasets/master/gapminder2007.csv'
df = pd.read_csv(file)

# Initialize the app
app = Dash(__name__)

# App layout
app.layout = html.Div([
    dmc.Switch(label="Line", checked=False, onLabel="ON", offLabel="OFF", id='line_switch'),
    dcc.Graph(id='scatter_graph')
])

# Add controls to build the interaction
@app.callback(
    Output("scatter_graph", "figure"),
    Input("line_switch", "checked"),
)
def Switch_Update(checked_state):
    figure=px.scatter(df, x='lifeExp', y='gdpPercap')

    if checked_state:
        figure.add_vline(x=80, line_width=3, line_dash="dash", line_color="green")
        return  figure
    else:
        return figure

# Run the app
if __name__ == '__main__':
    app.run(debug=True)
Cheers!
Btw your profile pic is very familiar to me. I lived in Leuven for 3 years! ![]()
1 Like
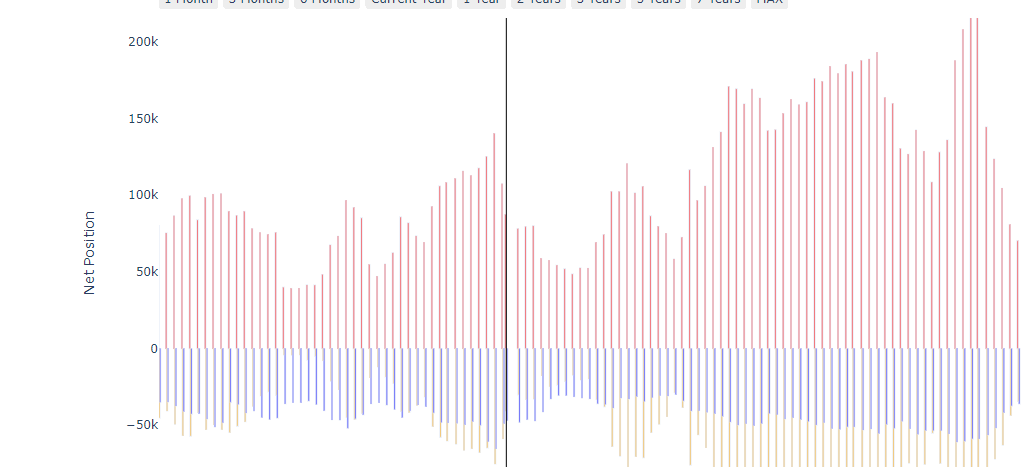
thanks for the response. what i was thinking like if we can create a function for adding the vertical line in the clicked date. Here is my code:
import pandas as pd
import plotly.graph_objects as go
from plotly.subplots import make_subplots
import ipywidgets as widgets
from IPython.display import display
import webbrowser

cot_data_df = pd.read_csv('GOLD 1995 till Oct.csv')

cot_data_df['Report_Date_as_YYYY_MM_DD'] = pd.to_datetime(cot_data_df['Report_Date_as_YYYY_MM_DD']).dt.strftime('%d-%m-%Y')

cot_data_df['Commercial_Net_Position'] = cot_data_df['Comm_Positions_Short_All'] - cot_data_df['Comm_Positions_Long_All']
cot_data_df['NonCommercial_Net_Position'] = cot_data_df['NonComm_Positions_Short_All'] - cot_data_df['NonComm_Positions_Long_All']
cot_data_df['NonRept_Net_Position'] = cot_data_df['NonRept_Positions_Short_All'] - cot_data_df['NonRept_Positions_Long_All']

# Calculate moving averages
cot_data_df['Commercial_Net_Position_MA'] = cot_data_df['Commercial_Net_Position'].rolling(window=12).mean()
cot_data_df['NonCommercial_Net_Position_MA'] = cot_data_df['NonCommercial_Net_Position'].rolling(window=12).mean()
cot_data_df['NonRept_Net_Position_MA'] = cot_data_df['NonRept_Net_Position'].rolling(window=12).mean()

fig = go.Figure()

fig.add_trace(
    go.Bar(
        x=cot_data_df['Report_Date_as_YYYY_MM_DD'],
        y=cot_data_df['Commercial_Net_Position'],
        name='Companies',
        marker_color='red',
        offsetgroup=0,
    )
)

fig.add_trace(
    go.Bar(
        x=cot_data_df['Report_Date_as_YYYY_MM_DD'],
        y=cot_data_df['NonCommercial_Net_Position'],
        name='Smart Money',
        marker_color='orange',
        offsetgroup=1,
    )
)

fig.add_trace(
    go.Bar(
        x=cot_data_df['Report_Date_as_YYYY_MM_DD'],
        y=cot_data_df['NonRept_Net_Position'],
        name='Retail',
        marker_color='blue',
        offsetgroup=2,
    )
)

fig.add_shape(
    go.layout.Shape(
        type="line",
        x0=cot_data_df['Report_Date_as_YYYY_MM_DD'].iloc[0],
        x1=cot_data_df['Report_Date_as_YYYY_MM_DD'].iloc[-1],
        y0=0,
        y1=0,
        line=dict(color="black", width=1, dash="dash"),
    )
)

# Create traces for moving averages
def create_ma_trace(y, name, color, visible=False):  # Set visible to False for initially off
    return go.Scatter(
        x=cot_data_df['Report_Date_as_YYYY_MM_DD'],
        y=y,
        mode='lines',
        name=name,
        line=dict(color=color, width=2),
        visible=visible
    )

commercial_ma_trace = create_ma_trace(cot_data_df['Commercial_Net_Position_MA'], 'Companies (MA)', 'red')
smart_money_ma_trace = create_ma_trace(cot_data_df['NonCommercial_Net_Position_MA'], 'Smart Money (MA)', 'orange')
retail_ma_trace = create_ma_trace(cot_data_df['NonRept_Net_Position_MA'], 'Retail (MA)', 'blue')

# Add the moving average traces to the figure
fig.add_trace(commercial_ma_trace)
fig.add_trace(smart_money_ma_trace)
fig.add_trace(retail_ma_trace)

fig.update_layout(
    xaxis_title='Report Date',
    yaxis_title='Net Position',
    title='Companies, Smart Money, and Retail of Gold',
    barmode='group',
)

updatemenu_buttons = [
    dict(label='All Moving Averages',
         method='update',
         args=[{'visible': [True, True, True, True, True, True, True]}, {'title': 'All Moving Averages'}]),
    dict(label='Companies (MA)',
         method='update',
         args=[{'visible': [True, False, False, True, False, False, True]}, {'title': 'Companies (MA)'}]),
    dict(label='Smart Money (MA)',
         method='update',
         args=[{'visible': [False, True, False, False, True, False, False]}, {'title': 'Smart Money (MA)'}]),
    dict(label='Retail (MA)',
         method='update',
         args=[{'visible': [False, False, True, False, False, True, False]}, {'title': 'Retail (MA)'}],
    )
]

fig.update_layout(
    updatemenus=[
        {
            'buttons': updatemenu_buttons,
            'direction': 'down',
            'showactive': True,
            'x': 1.0,
            'xanchor': 'left',
            'y': 1.1,
            'yanchor': 'top',
        }
    ]
)


def on_button_click(b):
    with output:
        fig.update_layout(width=1900, height=1000)
        fig.write_html('full_screen_plot.html', full_html=False)
        webbrowser.open('full_screen_plot.html', new=2)

screen_button = widgets.Button(description="Generate Full-Screen Plot")
screen_button.on_click(on_button_click)
output = widgets.Output()
screen_button.layout.margin = '0 0 0 80%'
display(screen_button, output)
fig.update_xaxes(
    tickformat='%d/%m/%Y',  # Set the desired date format
)
# Add always-visible crosshair cursor
fig.update_xaxes(showgrid=False, zeroline=False, rangeslider_visible=True, showticklabels=True,
                 showline=True, spikedash='dash', spikemode='across', fixedrange=False)
fig.update_yaxes(showspikes=True, spikedash='dash', spikemode='across', fixedrange=False)

fig.update_layout(
    title='Gold Liquidity Data',
    width=1100,
    height=900,
)
fig.write_html("New_Gold_Liquidity_Data.html")
fig.show()
"Have a look maybe you could have any idea about this
"
In theory, you can use SelectData attribute of dcc.Graph component. However, it does not work fluently with time series data, since it is hard to click on the exact data points, instead I would use that attribute with scatter graphs. Nevertheless, you can get more info about how to use them from here.
I don’t know what you are aiming with vertical lines, however you may also want to check range sliders for time series data.
Hope these would help you on what you’re trying to accomplish!
Also it would be very helpful for reader to read your code easily if you could enclose your code within Reformatted text format. You can do it by simply selecting the ‘</>’ icon which is located just above the text input area.
Like this
just did this.
1 Like
Hey @ds2636037 again,
It turns out that you can make a button toggle by playing with its style property, specifically, its opacity. Feel free to experiment with other style properties such as color, bgcolor etc. sky is the limit!
Here is a simple code for you to make your first step easier:
from dash import Dash, html, callback, Input, Output

external_stylesheets = ['https://codepen.io/chriddyp/pen/bWLwgP.css']

app = Dash(__name__, external_stylesheets=external_stylesheets)
app.layout = html.Div([
    html.Div(
        id='button-to-be-toggled',
        children=[
        html.Button('Toggle Me!', id='toggle-button')
        ],
        style = {'height': '75rem',
                'display': 'flex',
                'align-items': 'center',
                'justify-content': 'center'}
             ),
])


@callback(
    Output('toggle-button', 'style'),
    Input('toggle-button', 'n_clicks'),
)
def toggle_button(n_clicks):
    if n_clicks is None:
        n_clicks = 1
        n_clicks = n_clicks + 1

    if n_clicks%2==0:
        return None
    else:
        style={'opacity':'0.25'}
        return style


if __name__ == '__main__':
    app.run(debug=True)
Cheers!