import plotly.graph_objs as go
fig = go.Figure()
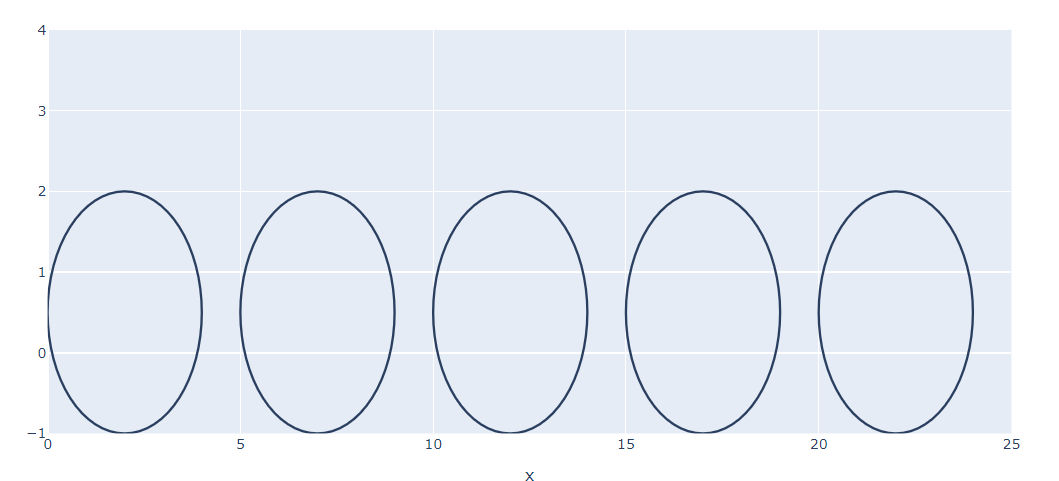
for i in range(5):
fig.add_shape(type="circle", xref="x", yref="y", x0=i*5, y0=-1, x1=i*5+4, y1=2,name='shape')
fig.update_xaxes(title_text='x',range=[0, 25],)
fig.update_layout(showlegend=True)
fig.show()
It is not possible to add legend items to shapes, unfortunately. Do you want it to be able to control the visibility of each shape or just “to give them a label”? There are workarounds for both, I think…
dear @jlfsjunior
Thanks for your guidance
I don’t know how did you read my mind???
Exactly I want to make all the shapes as a group of shapes and with a click on legend (or something like that) hide them!
I can draw circles with scatter and then I have many options in this way (like legend and …) . I think plotly tries to force users to use scatter or 3Dscatter instead of all other methods. Am I thinking correct?