Hovertext overshoots background box


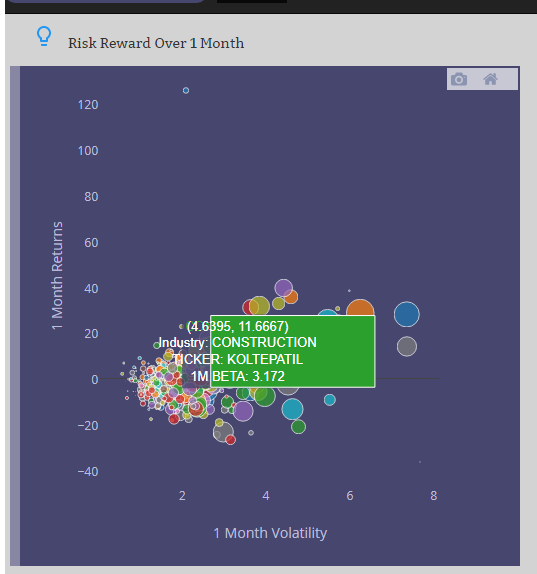
As seen the image above, the hovertext at times goes outside the colored background box.
This does not happen for all the points in the plot.

Following is my code

            let traces = [];
    		let categories = [];
    		let stocks = this.props.eqdata;
    		let BETATOSIZE = 6
    		PlotlyCore.register(PlotlyScatter)

    		for (let i = 0; i < stocks.length; i += 1) {
    		    if (categories.indexOf(stocks[i].Industry) === -1) {
    		        traces.push({x: [],
    		                     y: [],
    		                     mode: 'markers',
    		                     name: stocks[i].Industry,
    		                     text: [],
    		                     showlegend: false,
    		                     marker: {
    							          sizemode: 'diameter',
    							          size: [],
    							          
          								}
    		                    });
    		        categories.push(stocks[i].Industry);
    		  	} 

    	        traces[categories.indexOf(stocks[i].Industry)].x.push(stocks[i].vol);
    	        traces[categories.indexOf(stocks[i].Industry)].y.push(stocks[i].returns20);
    	        traces[categories.indexOf(stocks[i].Industry)].text.push("Industry: ".concat(stocks[i].Industry, "<br>TICKER: ", stocks[i].variable, "<br>1M BETA: ",stocks[i].beta1M) ) ;
    	        traces[categories.indexOf(stocks[i].Industry)].marker.size.push(Math.abs(stocks[i].beta1M)*BETATOSIZE) ;
    	        
    		  
    		}
    		
    		let layout = Object.assign({},PlotlyLayout)
    		layout.xaxis= {title: '1 Month Volatility', showgrid: false, }
    		layout.yaxis= {title: '1 Month Returns', showgrid: false, }
    		
    		// hide the modebar (hover bar) buttons, plotly logo. show plotly tooltips
         	let defaultPlotlyConfiguration = { modeBarButtonsToRemove: ['sendDataToCloud', 'pan2d', 'zoomIn2d', 'zoomOut2d', 'zoom2d', 'toggleSpikelines'  ,'autoScale2d', 'hoverClosestCartesian', 'hoverCompareCartesian', 'lasso2d', 'select2d'], displaylogo: false, showTips: true };
    		PlotlyCore.plot('plot', traces, layout, defaultPlotlyConfiguration);

PlotlyLayout is exported as follows

export const PlotlyLayout = { 
					    
    margin: {t:0,},
    padding: {r: '1em', t:'1em', },
    width: 500,
  	height: 500,
    autosize: true ,
    paper_bgcolor: themeColors.dark,
	plot_bgcolor: themeColors.dark,
	font: {color: '#BDBDD7'},
	yaxis: {showgrid: false, },
	hovermode: 'closest', // so the hover shows the closest data and not the entire x axis data
}

Any idea how I can fix this please?
Thanks

Is there any other CSS going on on your page?

I can’t replicate this in a sandbox environment.

No.
This is my render code

               <div >	
		    			        

			        <IconButton tooltip="Help" style = {{paddingTop:0, marginTop:0}} onClick={() => modalDisplay('eqrrInfoModal')}>
				      <LightBulbOutlineIcon color={blue500}/>} />
				    </IconButton>
				    Risk Reward Over 1 Month 
			        <Dialog
			          title="Risk Adjusted Returns Over A Month"
			          modal={false}
			          actions={actions}
			          open={componentStates.eqrrInfoModal}   
			          onRequestClose={() => modalDisplay('eqrrInfoModal')}       
			        >
			          This chart shows risk profiles of all stocks of 500 NSE stocks. <br/>
			          Bubbles are sized according to their beta over past 1 month.
			        </Dialog>

		        	
			        <div id="plot"></div>


		    </div>

There is no css for the id plot. There are no classes defined here.

I should probably mention this chart has about 500 bubbles

OK, can you try to make a fully reproducible example of the problem?

I tried to make a reproducible example with dummy data on codepen but it didn’t work. Or rather it worked.
This is slightly awkward. I tried to use the real data, which is about 200kb, on codepen but it’s probably too big for it.

This is the json.

If you do

let traces = /* the content above*/

let defaultPlotlyConfiguration = { modeBarButtonsToRemove: ['sendDataToCloud', 'pan2d', 'zoomIn2d', 'zoomOut2d', 'zoom2d', 'toggleSpikelines'  ,'autoScale2d', 'hoverClosestCartesian', 'hoverCompareCartesian', 'lasso2d', 'select2d'], displaylogo: false, showTips: true };

let PlotlyLayout = { 
					    
    margin: {t:0,},
    padding: {r: '1em', t:'1em', },
    width: 500,
  	height: 500,
    autosize: true ,
    font: {color: '#BDBDD7'},
	  yaxis: {showgrid: false, },
	  hovermode: 'closest', // so the hover shows the closest data and not the entire x axis data
}


Plotly.plot('myDiv', traces, PlotlyLayout, defaultPlotlyConfiguration);

I believe you could reproduce the example with problem. And you may have to move mouse around a bit till problem data points show up.
Let me know if there is a better way to share the problem.
Thanks