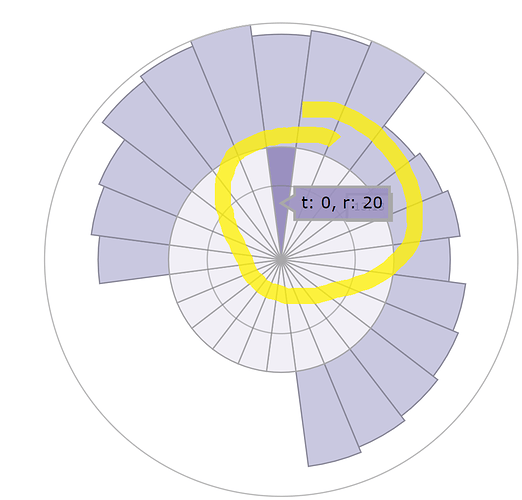
I am currently customising a Wind Rose chart in Dash…I’d like to disable all hover events for a particular trace, but it simply will not disappear! I’m using Python.
Here is a screenshot of the hoverinfo that continues to pop up:
Here is my code to create the figure, which I then simply add to the Dash app:
trace3 = go.Area(
    r=[40.0, 41, 42, 30.0, 31, 32, 30.0, 33, 34, 35.0, 36, 37, 7.5, 8, 9, 7.5, 9, 10, 32.5, 34, 35, 40.0, 41, 42],
    t=t,
    name='5-8 m/s',
    marker=dict(
        color='rgb(203,201,226)',
    )
)
trace4 = go.Area(
    r=[20, 20, 20, 20, 20, 20, 20, 20, 20, 20, 20, 20, 20, 20, 20, 20, 20, 20, 20, 20, 20, 20, 20, 20],
    t=t,
    name='< 5 m/s',
    marker=dict(
        color='rgb(242,240,247)'
    ),
    hoverinfo="skip"
)
data = [trace3, trace4]
layout = go.Layout(
    title='',
    font=dict(
        size=16
    ),
    legend=dict(
        font=dict(
            size=16
        )
    ),
    radialaxis=dict(
        ticksuffix='%',
        visible = False,
        showgrid=False,
        showline=False
    ),
    angularaxis=dict(
        visible=False,
        showgrid = False,
        showline = False
    ),
    grid=dict(xgap=0,ygap=0),
    orientation=270
)
fig = go.Figure(data=data, layout=layout)
