hello to all,
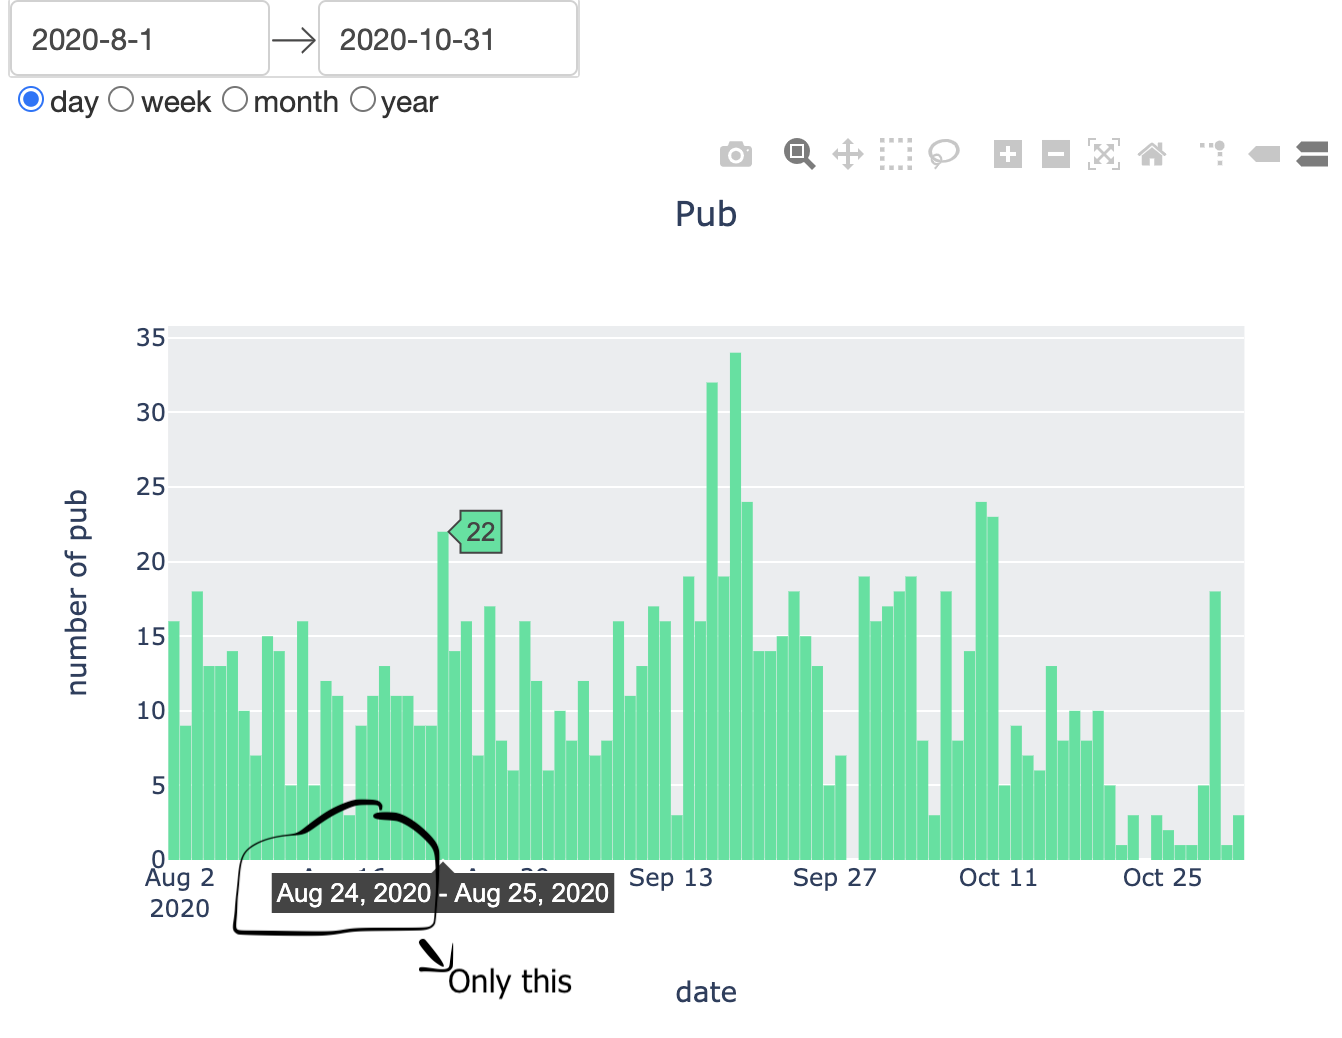
I have created the histogram below which gives the number of pub per day. In the black hover data I have the start and end day. Do you know how to display only the start day since it only concerns one day?
Her my code:
    fig.add_trace(go.Histogram(x=dff2['createdAt.$date'],
    marker_color = "#00e39b",
    xbins=dict(start=start_date, end=end_date, size=size_), autobinx=False
    ))


    fig.update_layout(
        title_text='Pub',
        title_x = 0.5,
        xaxis_title_text='date',
        yaxis_title_text='number of pub',
        bargap=0.05,
        plot_bgcolor="#EBEDEF",
        hovermode="x",
      )