Hello,
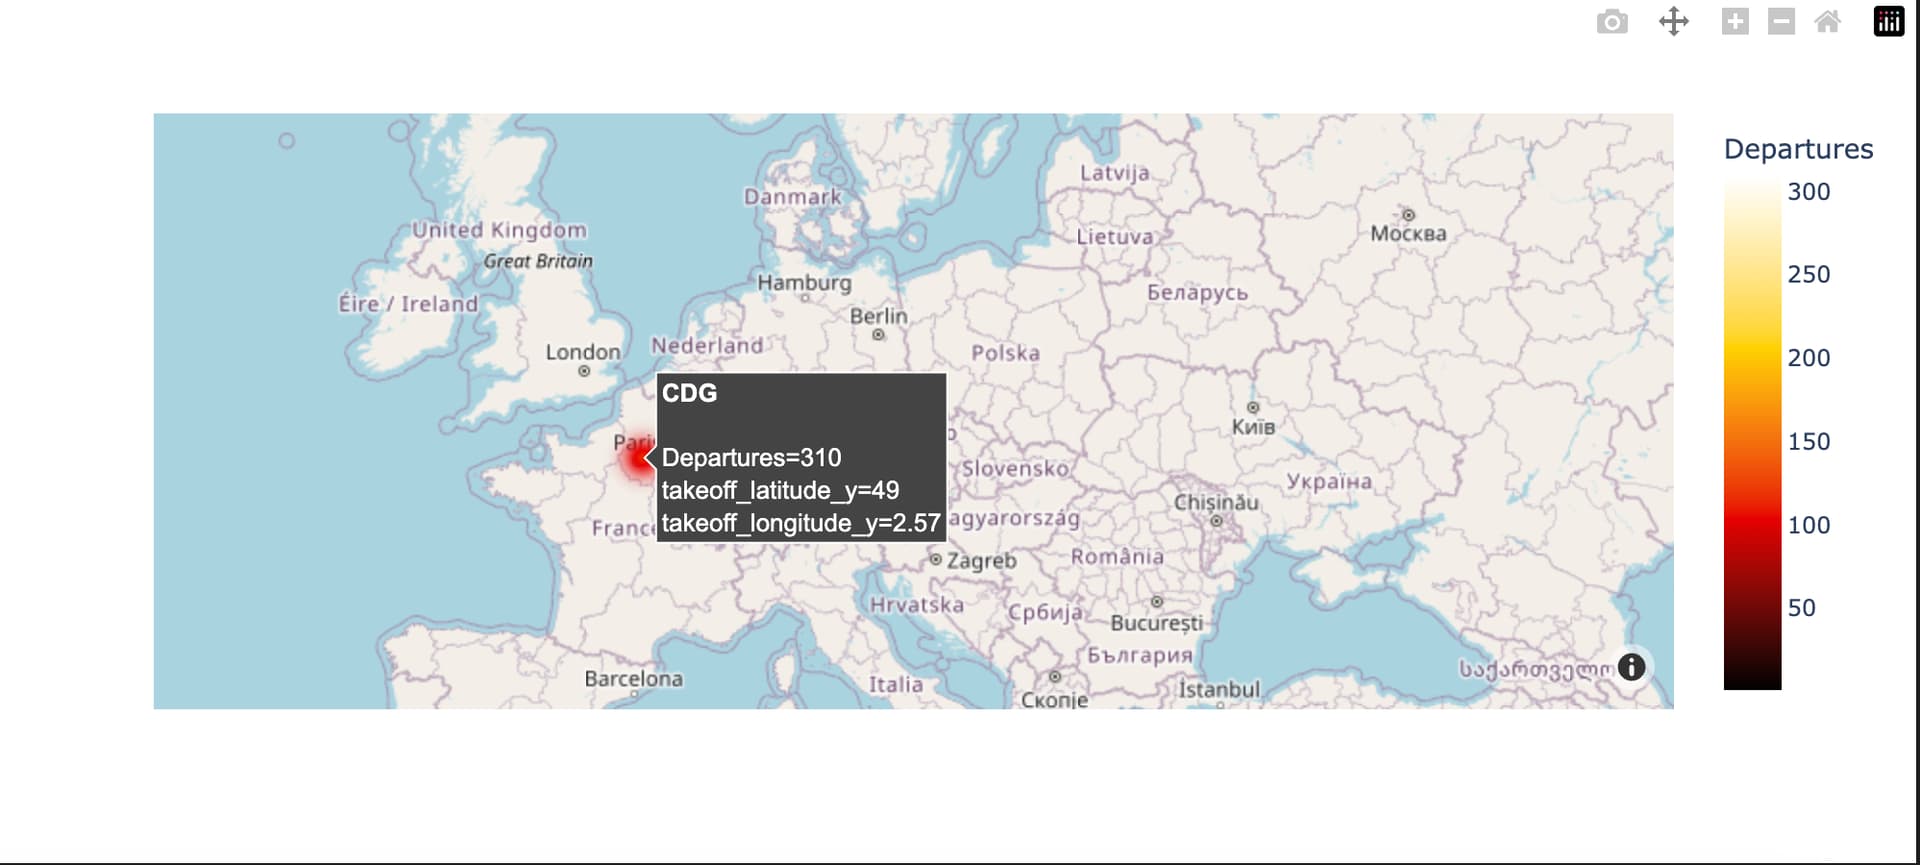
I try to generate a world map with an overlaying heatmap. However, the colorcoding on the map is not correct (hovering over the data points does show that the values are correct) and the circles on the map are somehow a bit fuzzy. Does anyone know why this is the case?

fig = px.density_mapbox(destinations, lat=destinations.takeoff_latitude_y, lon=destinations.takeoff_longitude_y,
                        z=destinations.Departures, hover_name='orig_airport', radius=20, center=dict(lat=50.37, lon=14.97), zoom=1,
                        color_continuous_scale=px.colors.sequential.Hot, mapbox_style="open-street-map")

fig.show()