MATLAB’s subplot(m,n,p) functionality divides the current figure into an m-by-n grid and creates axes in the position specified by p . MATLAB® numbers subplot positions by row. The first subplot is the first column of the first row, the second subplot is the second column of the first row, and so on. If axes exist in the specified position, then this command makes the axes the current axes.
The Plotly library for MATLAB is quite careful to try to faithfully recreate this useful MATLAB function. For this it is not necessary to set any optional parameter in fig2plotly. Plotly for MATLAB simply recreates the MATLAB figure as it has been configured using subplot. Below we list a series of examples to test the success of this functionality with matlab_plotly
Upper and Lower Subplots
Create a figure with two stacked subplots. Plot a sine wave in each one.
subplot(2,1,1);
x = linspace(0,10);
y1 = sin(x);
plot(x,y1)

subplot(2,1,2);
y2 = sin(5*x);
plot(x,y2)

fig2plotly(gcf, 'offline', 1);
Quadrant of Subplots
Create a figure divided into four subplots. Plot a sine wave in each one and title each subplot.
subplot(2,2,1)
x = linspace(0,10);
y1 = sin(x);
plot(x,y1)
title('Subplot 1: sin(x)')

subplot(2,2,2)
y2 = sin(2*x);
plot(x,y2)
title('Subplot 2: sin(2x)')

subplot(2,2,3)
y3 = sin(4*x);
plot(x,y3)
title('Subplot 3: sin(4x)')

subplot(2,2,4)
y4 = sin(8*x);
plot(x,y4)
title('Subplot 4: sin(8x)')

fig2plotly(gcf, 'offline', 1);
Subplots with Different Sizes
Create a figure containing with three subplots. Create two subplots across the upper half of the figure and a third subplot that spans the lower half of the figure. Add titles to each subplot.
subplot(2,2,1);
x = linspace(-3.8,3.8);
y_cos = cos(x);
plot(x,y_cos);
title('Subplot 1: Cosine')

subplot(2,2,2);
y_poly = 1 - x.^2./2 + x.^4./24;
plot(x,y_poly,'g');
title('Subplot 2: Polynomial')

subplot(2,2,[3,4]);
plot(x,y_cos,'b',x,y_poly,'g');
title('Subplot 3 and 4: Both')

fig2plotly(gcf, 'offline', 1);
Replace Subplot with Empty Axes
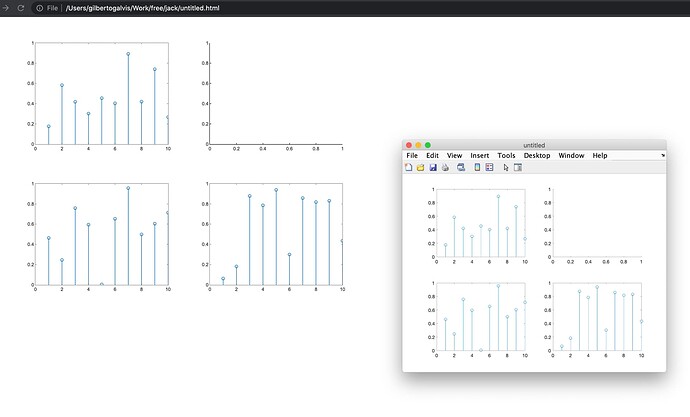
Create a figure with four stem plots of random data. Then replace the second subplot with empty axes.
for k = 1:4
    data = rand(1,10);
    subplot(2,2,k)
    stem(data)
end

fig2plotly(gcf, 'offline', 1);
% Replace Subplot with Empty Axes
for k = 1:4
    data = rand(1,10);
    subplot(2,2,k)
    stem(data)
end

subplot(2,2,2,'replace')

fig2plotly(gcf, 'offline', 1);
Subplots at Custom Positions
Create a figure with two subplots that are not aligned with grid positions. Specify a custom position for each subplot.
pos1 = [0.1 0.3 0.3 0.3];
subplot('Position',pos1)
y = magic(4);
plot(y)
title('First Subplot')

pos2 = [0.5 0.15 0.4 0.7];
subplot('Position',pos2)
bar(y)
title('Second Subplot')

fig2plotly(gcf, 'offline', 1);
Create Subplots with Polar Axes
Create a figure with two polar axes. Create a polar line chart in the upper subplot and a polar scatter chart in the lower subplot.
figure
ax1 = subplot(2,1,1,polaraxes);
theta = linspace(0,2*pi,50);
rho = sin(theta).*cos(theta);
polarplot(ax1,theta,rho)

ax2 = subplot(2,1,2,polaraxes);
polarscatter(ax2,theta,rho)

fig2plotly(f, 'offline', 1, 'TreatAs', {'scatterpolar', 'polarplot'});
Modify Axes Properties After Creation
Create a figure with two subplots. Assign the Axes objects to the variables ax1 and ax2 . Specify the Axes objects as inputs to the plotting functions to ensure that the functions plot into a specific subplot.
ax1 = subplot(2,1,1);
Z = peaks;
plot(ax1,Z(1:20,:))

ax2 = subplot(2,1,2);
plot(ax2,Z)

fig2plotly(gcf, 'offline', 1);
Make Subplot the Current Axes
Create a figure with multiple subplots. Store the Axes objects in vector ax . Then make the second subplot the current axes. Create a line chart and change the axis limits for the second subplot. By default, graphics functions target the current axes.
for k = 1:4
    ax(k) = subplot(2,2,k);
end

subplot(ax(2))
x = linspace(1,50);
y = sin(x);
plot(x,y,'Color',[0.1, 0.5, 0.1])
title('Second Subplot')
axis([0 50 -1 1])

fig2plotly(gcf, 'offline', 1);
Convert Existing Axes to Subplot
Create a line chart. Then convert the axes so that it is the lower subplot of the figure. The subplot function uses the figure in which the original axes existed.
x = linspace(1,10);
y = sin(x);
plot(x,y)
title('Sine Plot')

fig2plotly(gcf, 'offline', 1);
% Convert Existing Axes to Subplot
x = linspace(1,10);
y = sin(x);
plot(x,y)
title('Sine Plot')

ax = gca;
subplot(2,1,2,ax)

fig2plotly(gcf, 'offline', 1);
Convert Axes in Separate Figures to Subplots
Combine axes that exist in separate figures in a single figure with subplots.
Create two plots in two different figures. Assign the Axes objects to the variables ax1 and ax2 . Assign the Legend object to the variable lgd .
figure
x = linspace(0,10);
y1 = sin(x);
plot(x,y1)
title('Line Plot 1')

fig2plotly(gcf, 'offline', 1);
figure
x = linspace(0,10);
y1 = sin(x);
plot(x,y1)
title('Line Plot 1')

ax1 = gca;

figure
y2 = 2*sin(x);
plot(x,y2)
title('Line Plot 2')
lgd = legend('2*Sin(x)');

fig2plotly(gcf, 'offline', 1);
% Convert Axes in Separate Figures to Subplots
figure
x = linspace(0,10);
y1 = sin(x);
plot(x,y1)
title('Line Plot 1')

ax1 = gca;

figure
y2 = 2*sin(x);
plot(x,y2)
title('Line Plot 2')
lgd = legend('2*Sin(x)');
ax2 = gca;
Create copies of the two Axes objects using copyobj. Specify the parents of the copied axes as a new figure. Since legends and colorbars do not get copied with the associated axes, copy the legend with the axes.
fnew = figure;
ax1_copy = copyobj(ax1,fnew);
subplot(2,1,1,ax1_copy)

copies = copyobj([ax2,lgd],fnew);
ax2_copy = copies(1);
subplot(2,1,2,ax2_copy)

fig2plotly(gcf, 'offline', 1);


