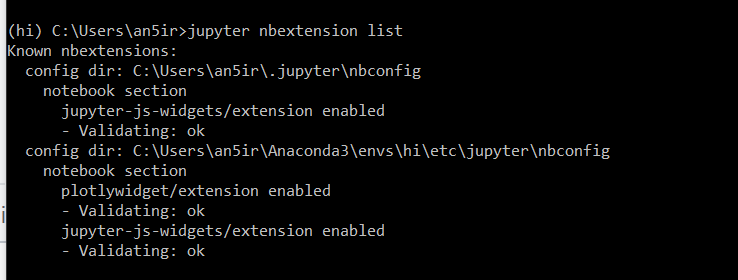
Hi,
im trying to to create an interactive graph in networkx where you can click on one of the nodes and it update another graph beside it?
i am using Jupiter notebook and have plotly 3.3.0, notebook 5.7 and ipywidgets 7.4.2 installed.
when running the following code:
import plotly.graph_objs as go
import networkx as nx
import numpy as np
G=nx.random_geometric_graph(3,0.99)
pos=nx.get_node_attributes(G,'pos')
edge_trace = go.Scatter(
x=[],
y=[],
line=dict(width=0.5,color='#888'),
hoverinfo='none',
mode='lines')
for edge in G.edges():
x0, y0 = G.node[edge[0]]['pos']
x1, y1 = G.node[edge[1]]['pos']
edge_trace['x'] += tuple([x0, x1, None])
edge_trace['y'] += tuple([y0, y1, None])
node_trace = go.Scatter(
x=[],
y=[],
text=[],
mode='markers',
hoverinfo='text',
marker=dict(
showscale=True,
colorscale='YlGnBu',
reversescale=True,
color=[],
size=10,
colorbar=dict(
thickness=15,
title='Node Connections',
xanchor='left',
titleside='right'
),
line=dict(width=2)))
for node in G.nodes():
x, y = G.node[node]['pos']
node_trace['x'] += tuple([x])
node_trace['y'] += tuple([y])
for node, adjacencies in enumerate(G.adjacency()):
node_trace['marker']['color']+=tuple([len(adjacencies[1])])
node_info = '# of connections: '+str(len(adjacencies[1]))
node_trace['text']+=tuple([node_info])
fw_graph = go.FigureWidget(data=[edge_trace, node_trace],
layout=go.Layout(
title='<br>Network graph made with Python',
titlefont=dict(size=16),
showlegend=False,
width=400, height=400,
hovermode='closest',
margin=dict(b=20,l=5,r=5,t=40),
annotations=[ dict(
text="Python code: <a href='https://plot.ly/ipython-notebooks/network-graphs/'> https://plot.ly/ipython-notebooks/network-graphs/</a>",
showarrow=False,
xref="paper", yref="paper",
x=0.005, y=-0.002 ) ],
xaxis=dict(showgrid=False, zeroline=False, showticklabels=False),
yaxis=dict(showgrid=False, zeroline=False, showticklabels=False)))
trace1 = go.Bar(
x=['giraffes', 'orangutans', 'monkeys'],
y=[20, 14, 23],
name='SF Zoo'
)
trace2 = go.Bar(
x=['giraffes', 'orangutans', 'monkeys'],
y=[12, 18, 29],
name='LA Zoo'
)
#data = [trace1, trace2]
layout2 = go.Layout(width=400, height=300, xaxis=dict(showline=True, zeroline=False, ticklen=4),
yaxis=dict(range=[9, 31], showline=True, zeroline=False, ticklen=4), hovermode='closest',
barmode='group'
)
fw_analytics = go.FigureWidget(data=[trace1, trace2], layout=layout2)
#iplot(fw_analytics, show_link=False)
import ipywidgets as ipw
def callback(trace, points, state):
if not points.point_inds:
return
ind = points.point_inds[0] # get the index of the hovered node
# use this index to extract data for the analytics of this node index
# and then use these data to update the previous fw_analytics
with fw_analytics.batch_update(): # update the fw_analytics with info extracted from the last
# hovered node
fw_analytics.data[0].y = np.random.randint(10,30,size=3)
fw_analytics.data[1].y = np.random.randint(10,30,size=3)
trace = fw_graph.data[1]
trace.on_hover(callback)
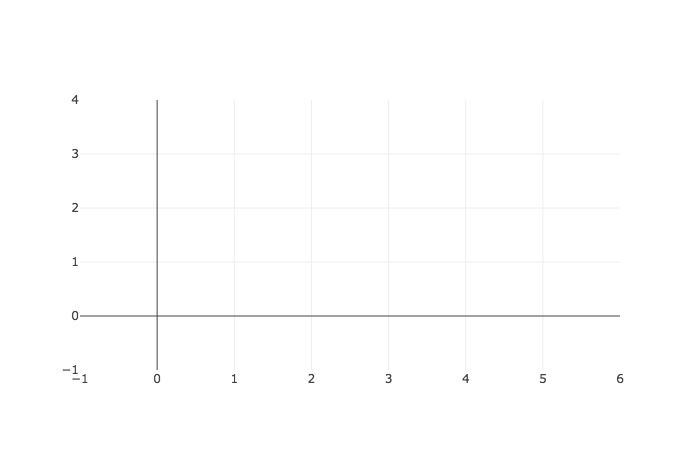
ipw.HBox([fw_graph, fw_analytics])
i get a blank out put instead of graphs?
why does the Bbox not work?
if i plot the graphs individually using
from plotly.offline import iplot
from plotly.offline import init_notebook_mode
init_notebook_mode()
iplot(fw_graph)
they work fine.