I’m using go.Scattermapbox to generate multiple lines in a map from a CSV file which has coordinates and attributes, and it looks like this:
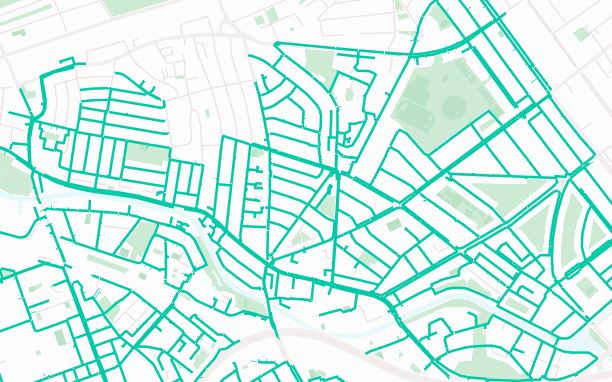
What I’m doing here is connecting all the coordinates with the same ID, which is quite fast as there is only one object plotting all the lines I need.
What I need to achieve now is to set colors to each line, based on some attributes, like this:
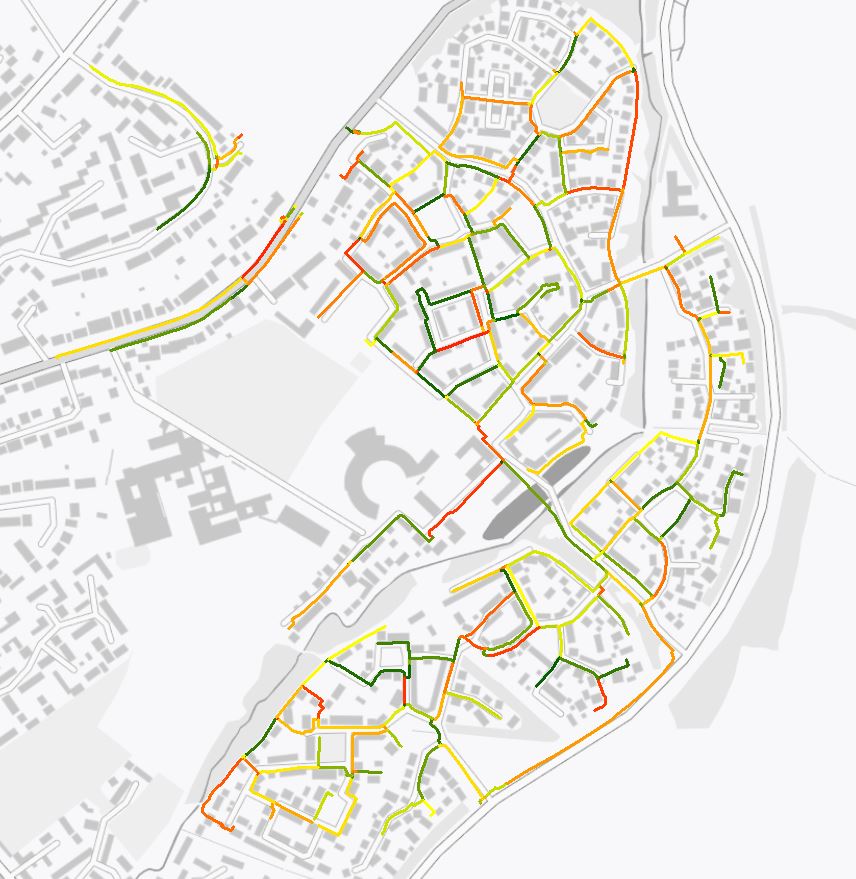
This is something that I’m afraid I can’t achieve using a single go.Scattermapbox object, and using a loop would be something very slow as this is big data (even if I filter the data, there are thousands of ids to plot).
Is there a way to achieve this without creating a loop for? Maybe converting my data into json?