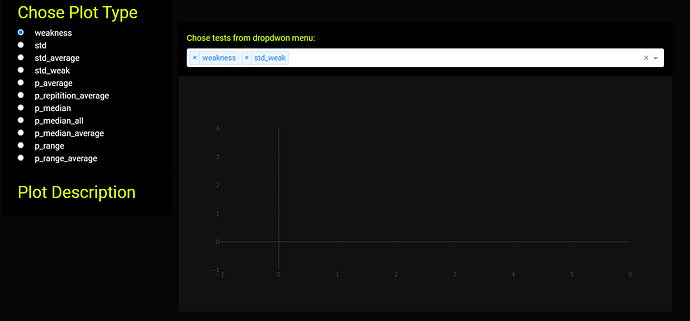
Hi,
I have a graph that takes a couple of values from a radoitems and a dropdown dcc. the problem is, when I start dash, the Graph doesn’t initialize automatically from the default values defined in the two dcc components, leaving a white background in black-themed dash. Only, when I chose another item from the dropdown menu that the Graph start updating.
So my question is, why is dash not starting the graph from the default values of the dropdown menu when I first open it?
And how can I get rid of the white background that initially appears on the board?
Here is the dahs part of the code:
 plots_names = ['weakness', 'std', 'std_average', 'std_weak', 'p_average', 'p_repitition_average', 'p_median','p_median_all', 'p_median_average','p_range', 'p_range_average']

 colors = {'background': '#111111', 'text': '#7FDBFF'}

 app = Dash(__name__, external_stylesheets=[dbc.themes.CYBORG])
 app.layout = dbc.Container([
     #Main Row
     dbc.Row([

         #Left Column
         dbc.Col([

             #DashBoard Heading
             dbc.Row([

                 #heading logo
                 dbc.Col([html.Img( src=app.get_asset_url('theon-logo-horizontal-white.webp'),
                                     height='56px',
                                     className='mt-5')
                         ], sm=4, lg=12, md=3),

                     ], id="heading"),

             dbc.Row(html.Br()),
             #Plots pick

             dbc.Row([
                 dbc.Card(dbc.CardBody([html.H4("Chose Plot Type", className="card-title", style = {'color':'#CFFF00'}),
                                        dcc.RadioItems(plots_names, plots_names[0], id="plot-picker", labelStyle={'display': 'block'}, inputStyle={"margin-right": "20px"})]
                                       ),
                          color = 'black', inverse=True, outline= False, )
                     ]),


             dbc.Row(dbc.Card(dbc.CardBody([html.H4("Plot Description", className="card-title", style = {'color':'#CFFF00'}),
                                         dcc.Markdown(id='plot-explain',  link_target="_blank", className='card-text')]),
                         color = 'black', inverse=True, outline= False)
                     )
             ], width = {'size': 3, 'offset':0, 'order': 'first' }, md={'size': 3, 'offset':0, 'order': 'first' }),


         # Right Column
         dbc.Col([
             dbc.Row(html.Br()),
             dbc.Row(html.Br()),
             dbc.Row(html.Br()),
             dbc.Row(html.Br()),
             dbc.Row(html.Br()),
             dbc.Row(html.Br()),


             dbc.Card(dbc.CardBody([html.P("Chose tests from dropdwon menu:", className="card-title", style = {'color':'#CFFF00'}),
                     dcc.Dropdown(names, names[0], id="test-picker", multi = True, style = {'color':'black'}) ]),
                      color = 'black', inverse=True, outline= False),

             dbc.Card(dcc.Graph(id="plot",  style={'width':'100%','height': '150hv', 'float': 'left','display':'inline-block'})  ,
                      color = 'black', inverse=True, outline= False
                     )

             ], width= {'size':9, 'offset':0, 'order': 'first' }, md={'size': 9, 'offset':0, 'order': 'first' })

             ], className='mx-auto', justify='around')
 ])


 @app.callback(
     Output("plot", "figure"),
     [Input("plot-picker", "value"), Input("test-picker", "value")])
 def update_bar_chart(plot_picker, picker_test):
     i=0
     if plot_picker == 'weakness':
         data = []
         for test in picker_test:
             df = df_lists[test]
             p_value = [x for x in df.columns if x.startswith('pva')]
             n_rounds = len(p_value)
             trace = go.Bar(x=df.test_name, y = df.weak_rate, name  = '{}'.format(test))
             data.append(trace)

         layout = go.Layout(title = 'Fraction of weak and failed results per each Dieharder test', template = 'plotly_dark', paper_bgcolor='rgba(0,0,0,0)', plot_bgcolor='rgba(0,0,0,0)')
         fig = go.Figure(data, layout)
         fig.update_yaxes(title_text='Failed/weak fractions', showgrid=False)
         fig.update_xaxes(tickfont_size=8, showgrid=False)
         fig.update_yaxes(tickfont_size=8)
         #fig.update_layout(legend=dict(yanchor="top", y=0.99, xanchor="left", x=0.01))
         return fig
Thanks
