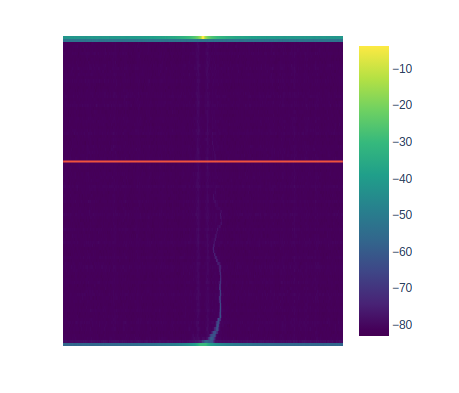
I am displaying an image with dash and imshow. Next, I add a line to the image. This line moves depending on the slider. But in the extreme positions, the image is deformed. Any solutions?
@app.callback(Output('all-spectr-plot-place', 'children'),
              Input('direction-slider', 'value'),
              Input('height-slider', 'value'),
              State('files-list', 'children'))
def show_all_spectr_plot(dir, height, files_list):
    data = get_wind_data(json.loads(files_list))
    sound_level = data.sound_level[dir]
    x = data.doppler_shift
    y = np.arange(0, data.num_height, 1)
    fig = px.imshow(
        sound_level, aspect='equal', color_continuous_scale='viridis', x=x, y=y, origin="lower", width=400, height=400)
    fig.add_trace(
        go.Scatter(x=np.linspace(data.doppler_shift[0], data.doppler_shift[-1], 2), y=[height] * 2, mode='lines'))
    fig.update_xaxes(visible=False, fixedrange=True)
    fig.update_yaxes(visible=False, fixedrange=True)
    fig.update_layout(annotations=[], overwrite=True)
    fig.update_layout(
        showlegend=False,
        plot_bgcolor="white",
        margin=dict(t=0, l=0, b=0, r=0),
        autosize=False,
        width=400,
        height=400,
    )
    return html.Div(dcc.Graph(figure=fig, id='all-spectr'))