Hello i am pretty new to dash,
Based on this question: How to populate a DropDown from unique values in a pandas data frame i am trying to create a table that is returning the unique values of the selected column via a dropdown menu.
My layout Div:
     html.Div(
         className = "section",
         children = [


             html.Div(className='section-title',children="Return the unique values of each column "),
             html.Div(
             dcc.Dropdown(
                 id='keyword_dropdown',
                 options=[{'label': i ,'value': i} for i in  df.columns],
                 multi=True,

                 placeholder='Filter by column:'
             ),style={}),
             html.Div(id='table-container')
     ]
     )
My function:
def genarate_vert_values_datable(dataframe,max_rows=10):
    return html.Table(
        [html.Tr([html.Th(col) for col in dataframe.columns])] +
        [html.Tr([
            html.Td(dataframe[col]) for col in dataframe.columns
        ]) for i in range(min(len(dataframe), max_rows))]
    )
My callback:
@app.callback(
    Output('table-container','children'),
    [Input('keyword_dropdown','value')]
)
def update_dropdown(drop_down_value):
    if drop_down_value is None:
        return None
    return genarate_vert_values_datable(df[drop_down_value])
What i get now is the values concatenated as shown bellow:
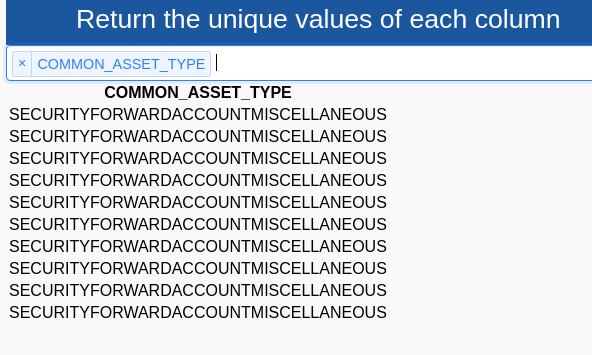
I would like to show each of the values in a vertical format when the dropdown is clicked with the preffered max rows :
EG
COMMON_ASSET_TYPE:
SECURITY
FORWARD
ACCOUNT
MISCELLANEOUS
Any hint of how i can do it?