Hello
Thanks
jack
October 20, 2017, 12:55am
2
Yep, just pass in the line chart before the bar chart in the data array and you should be good-to-go.
Thank you for the answer
line_data = bar_data[::-1]/2
index = np.arange(10)

trace1 = go.Scatter(
    x=index,
    y=line_data,
    name="Filled line",
    mode ="lines+markers",
    fill = "tozeroy",
    fillcolor = 'rgba(1,1,1, 0.8)',
    line = dict(
        width = 1),
    marker = dict(
        color = "#333",
        size = 5,
        symbol = '.'))

trace2 = go.Bar(
    x=index,
    y=bar_data,
    name="Bar")

traces = [
    trace1,
    trace2
]


layout = go.Layout(
    xaxis=dict(title='x axis'),
    yaxis=dict(title='y axis'),

    legend=dict(xanchor="center", orientation="h", x=0.5, y=-0.2),
    title='Title'
)

fig = go.Figure(data=traces, layout=layout)
py.iplot(fig)
gives the same whichever order I pass in the two traces (except that the colour of the bars shifts between blue and orange).
Am using plotly.offline and version 2.0.13.
gaw89
November 13, 2019, 12:23pm
6
Did you ever find a solution to this issue? I am experiencing the same problem now.
Thanks!
For this you can add a second y axis y2 overlaying y, as below
import plotly.graph_objects as go
import numpy as np
index = np.arange(10)
line_data = np.arange(10)
bar_data = np.ones(10)
bar_data[::2] = 2

trace1 = go.Scatter(
    x=index,
    y=line_data,
    name="Filled line",
    mode ="lines+markers",
    fill = "tozeroy",
    fillcolor = 'rgba(1,1,1, 0.8)',
    line = dict(
        width = 1),
    marker = dict(
        color = "#333",
        size = 5))

trace2 = go.Bar(
    x=index,
    y=bar_data,
    name="Bar",
    yaxis="y2")

traces = [
    trace1,
    trace2
]

fig = go.Figure(data=traces)
fig.update_layout(yaxis2=dict(overlaying='y'))
fig.show()
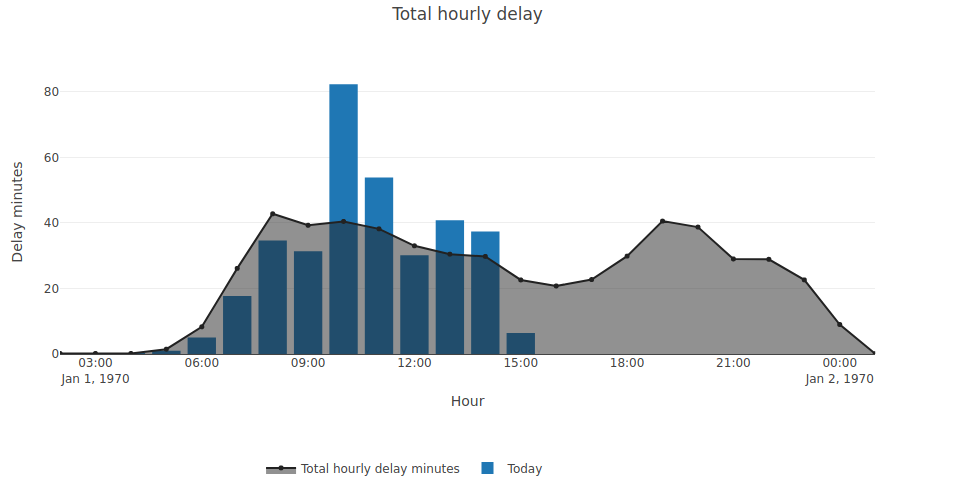
 Unfortunately it doesn’t seem to work for me. e.g: