Hey everyone,
I recently started to use Dash to create a Dashboard and it is a really convenient tool ! I almost finished what I want to achieve hoewever I ran into a problem than I really don’t know how to solve and I did not find the solution on the Forum.
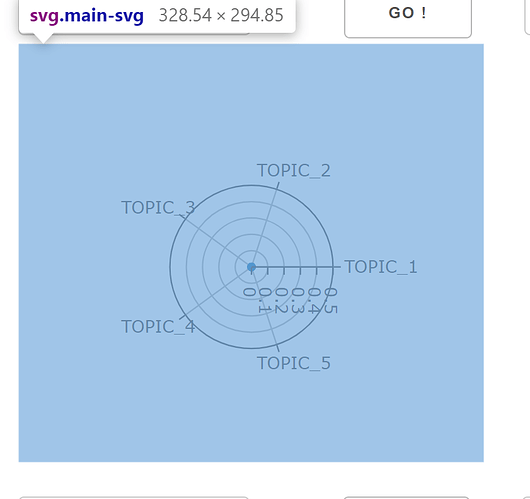
I created four radar plot on my dash but I do not know how to make them occupy the available space. Here is a screenshot of the svg.main-svg which occupy the space I want :
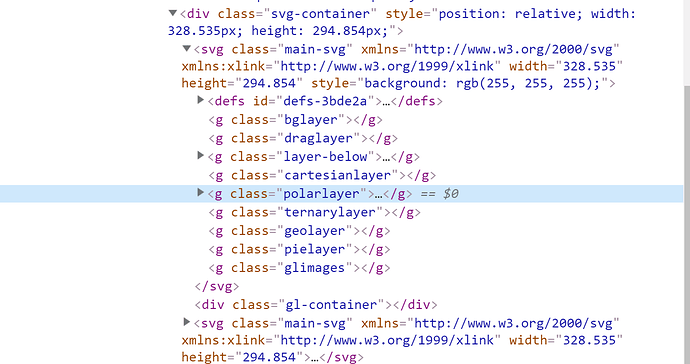
This is the space I want my figure to occupy, however the figure layer is way smaller :
I tried to change the width and height of the polarlayer class with an external css but it does not affect the figure at all. Is there a way to acually make the figure take the whole space within its container ?
Thank you very much !


